
- Start >
- Rivers >
- Discharge >
- Obere Donau >
- Neu Ulm, Bad Held >
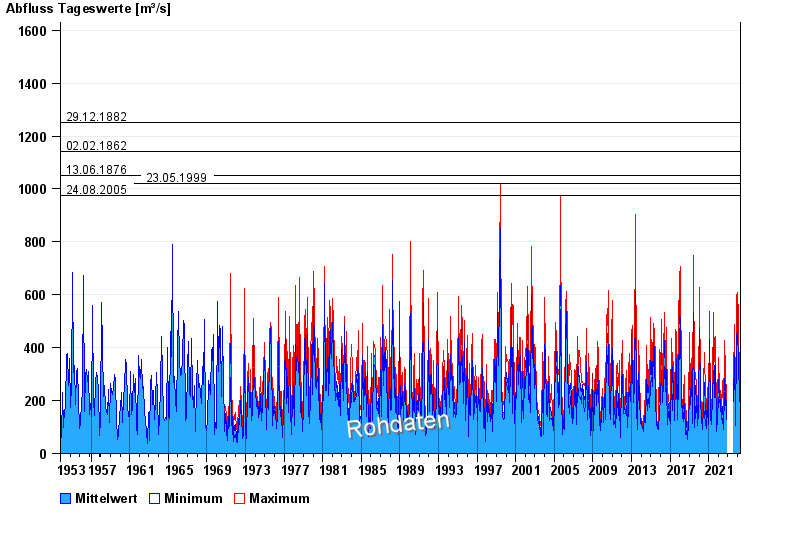
- Chart of total period

Chart of total period Neu Ulm, Bad Held / Donau
Discharge from 01.11.1953 to 18.04.2024
ACHTUNG!
Pegel durch außerordentlichen Kraftwerksbetrieb beeinflusst.
- 29.12.1882 Abfluss: 1250 m³/s
- 02.02.1862 Abfluss: 1140 m³/s
- 13.06.1876 Abfluss: 1050 m³/s
- 23.05.1999 Abfluss: 1020 m³/s
- 24.08.2005 Abfluss: 975 m³/s
| Date | Mean value [m³/s] | Maximum [m³/s] | Minimum [m³/s] |
|---|---|---|---|
| 18.04.2024 | 194 | 198 | 188 |
| 17.04.2024 | 166 | 192 | 147 |
| 16.04.2024 | 178 | 188 | 168 |
| 15.04.2024 | 155 | 173 | 142 |
| 14.04.2024 | 141 | 147 | 137 |
| 13.04.2024 | 135 | 142 | 128 |
| 12.04.2024 | 133 | 139 | 128 |
© Bayerisches Landesamt für Umwelt 2024