
- Start >
- Rivers >
- Discharge >
- Obere Donau >
- Nattenhausen >
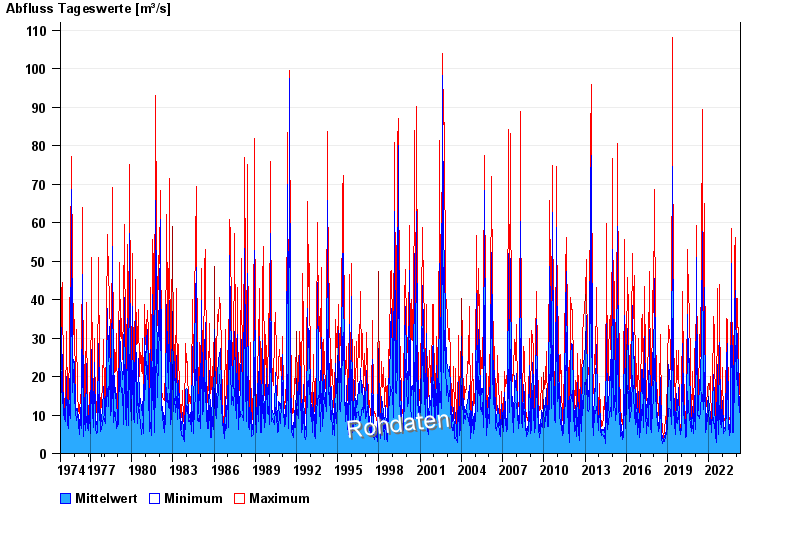
- Chart of total period

Chart of total period Nattenhausen / Günz
Discharge from 01.11.1974 to 19.04.2024
| Date | Mean value [m³/s] | Maximum [m³/s] | Minimum [m³/s] |
|---|---|---|---|
| 19.04.2024 | 10.7 | 12 | 9.92 |
| 18.04.2024 | 9.41 | 10.3 | 8.61 |
| 17.04.2024 | 7.86 | 8.96 | 6.79 |
| 16.04.2024 | 7.53 | 8.31 | 6.79 |
| 15.04.2024 | 6.85 | 8.61 | 5.39 |
| 14.04.2024 | 5.83 | 6.5 | 5.12 |
| 13.04.2024 | 5.95 | 6.5 | 5.39 |
© Bayerisches Landesamt für Umwelt 2024