
- Start >
- Rivers >
- Discharge >
- Obere Donau >
- München Tierärztl. Hochschule >
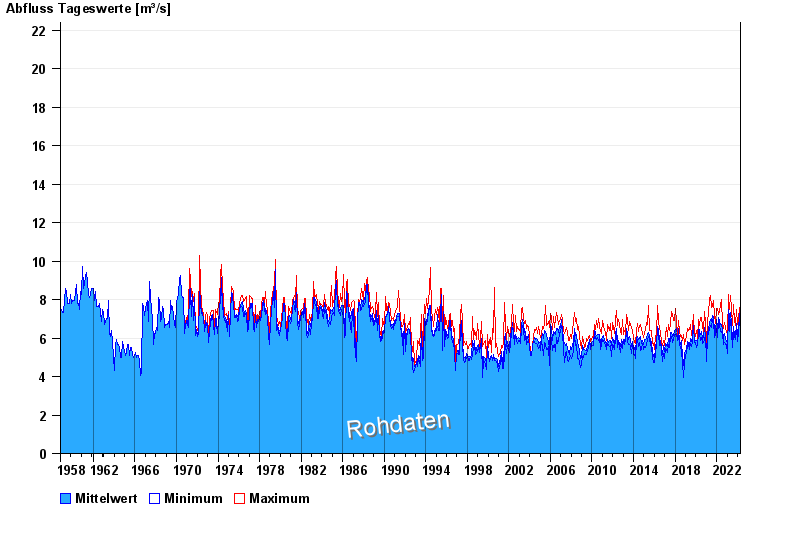
- Chart of total period

Chart of total period München Tierärztl. Hochschule / Schwabinger Bach
Discharge from 01.11.1958 to 18.04.2024
 Für diesen Pegel sind keine Jährlichkeiten hinterlegt.
| Date | Mean value [m³/s] | Maximum [m³/s] | Minimum [m³/s] |
|---|---|---|---|
| 18.04.2024 | 6.98 | 7.46 | 6.88 |
| 17.04.2024 | 7.14 | 7.17 | 7.03 |
| 16.04.2024 | 6.62 | 6.88 | 6.31 |
| 15.04.2024 | 6.69 | 7.03 | 6.31 |
| 14.04.2024 | 6.65 | 6.88 | 6.31 |
| 13.04.2024 | 6.75 | 7.03 | 6.31 |
| 12.04.2024 | 6.74 | 6.88 | 6.6 |
© Bayerisches Landesamt für Umwelt 2024