
- Start >
- Rivers >
- Discharge >
- Obere Donau >
- München >
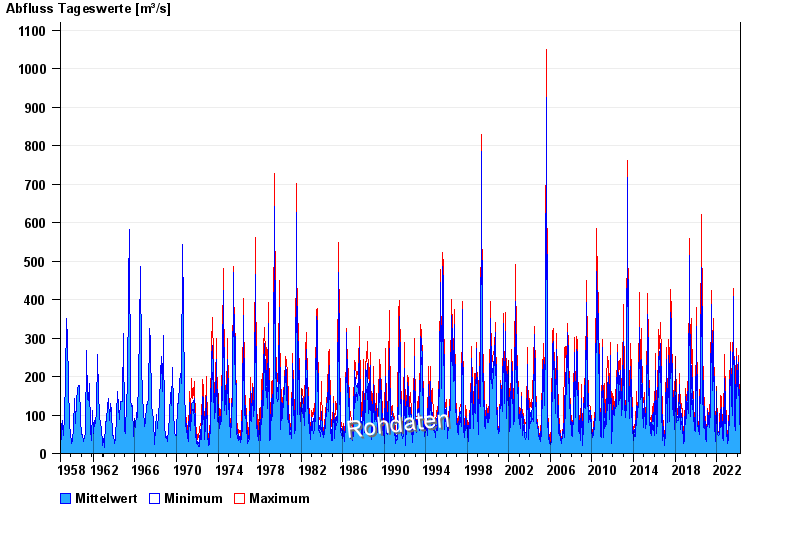
- Chart of total period

Chart of total period München / Isar
Discharge from 01.11.1958 to 20.04.2024
| Date | Mean value [m³/s] | Maximum [m³/s] | Minimum [m³/s] |
|---|---|---|---|
| 20.04.2024 | 62.6 | 67.8 | 54.2 |
| 19.04.2024 | 62.6 | 69.3 | 52.9 |
| 18.04.2024 | 60.1 | 65 | 52.9 |
| 17.04.2024 | 47.2 | 59.5 | 38.2 |
| 16.04.2024 | 38 | 42.4 | 35.3 |
| 15.04.2024 | 33.3 | 40.2 | 30.1 |
| 14.04.2024 | 32 | 33.5 | 29.3 |
© Bayerisches Landesamt für Umwelt 2024