
- Start >
- Rivers >
- Discharge >
- Obere Donau >
- Mering >
- Chart of year

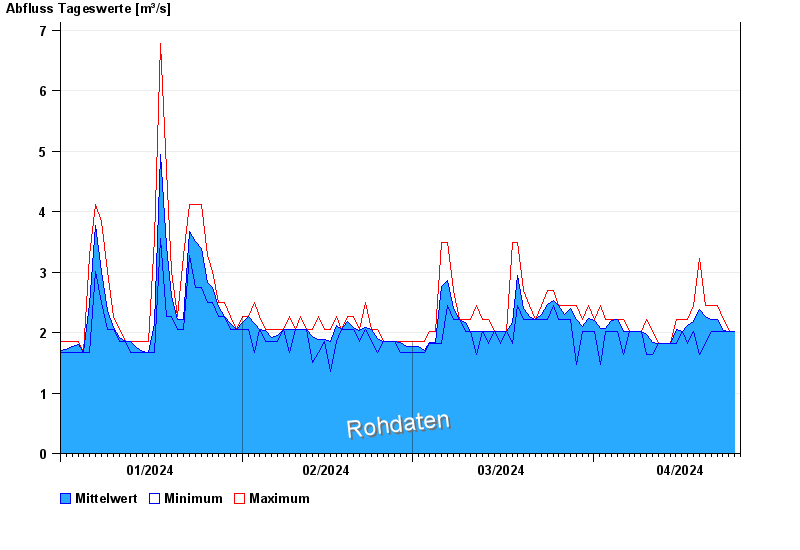
Chart of year Mering / Paar
Discharge from 01.01.2024 to 25.04.2024
| Date | Mean value [m³/s] | Maximum [m³/s] | Minimum [m³/s] |
|---|---|---|---|
| 25.04.2024 | 2.01 | 2.01 | 2.01 |
| 24.04.2024 | 2.01 | 2.01 | 2.01 |
| 23.04.2024 | 2.04 | 2.22 | 2.01 |
| 22.04.2024 | 2.22 | 2.45 | 2.01 |
| 21.04.2024 | 2.22 | 2.45 | 2.01 |
| 20.04.2024 | 2.26 | 2.45 | 1.82 |
| 19.04.2024 | 2.38 | 3.22 | 1.64 |
© Bayerisches Landesamt für Umwelt 2024