
- Start >
- Rivers >
- Discharge >
- Obere Donau >
- Langengeisling >
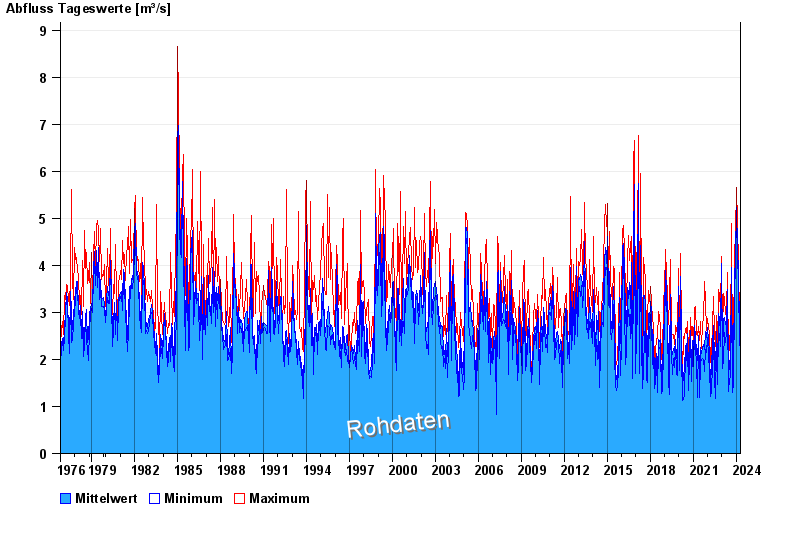
- Chart of total period

Chart of total period Langengeisling / Sempt
Discharge from 01.11.1976 to 20.04.2024
| Date | Mean value [m³/s] | Maximum [m³/s] | Minimum [m³/s] |
|---|---|---|---|
| 20.04.2024 | 2.56 | 2.78 | 2.41 |
| 19.04.2024 | 2.46 | 2.88 | 2.15 |
| 18.04.2024 | 2.42 | 2.68 | 2.23 |
| 17.04.2024 | 2.34 | 2.78 | 1.92 |
| 16.04.2024 | 2.11 | 2.41 | 1.92 |
| 15.04.2024 | 2.12 | 2.78 | 1.77 |
| 14.04.2024 | 1.9 | 2.07 | 1.77 |
© Bayerisches Landesamt für Umwelt 2024