
- Start >
- Rivers >
- Discharge >
- Obere Donau >
- Kelheim >
- Chart of year

Chart of year Kelheim / Donau
Discharge from 01.01.2019 to 31.12.2019
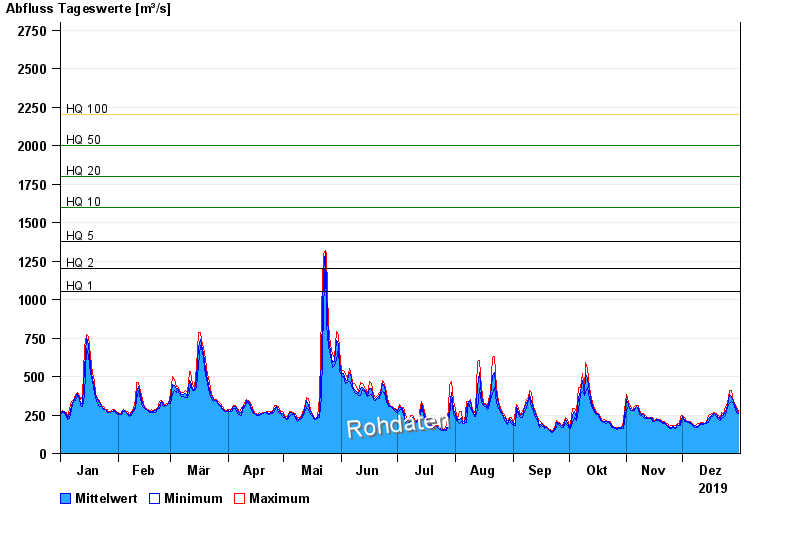
- HQ1 1050 m³/s
- HQ2 1200 m³/s
- HQ5 1380 m³/s
- HQ10 1600 m³/s
- HQ20 1800 m³/s
- HQ50 2000 m³/s
- HQ100 2200 m³/s
| Date | Mean value [m³/s] | Maximum [m³/s] | Minimum [m³/s] |
|---|---|---|---|
| 31.12.2019 | 267 | 274 | 262 |
| 30.12.2019 | 285 | 307 | 267 |
| 29.12.2019 | 315 | 325 | 307 |
| 28.12.2019 | 335 | 340 | 325 |
| 27.12.2019 | 368 | 410 | 338 |
| 26.12.2019 | 381 | 410 | 325 |
| 25.12.2019 | 313 | 322 | 304 |
© Bayerisches Landesamt für Umwelt 2024