
- Start >
- Rivers >
- Discharge >
- Obere Donau >
- Kelheim >
- Chart of total period

Chart of total period Kelheim / Donau
Discharge from 01.11.1900 to 24.04.2024
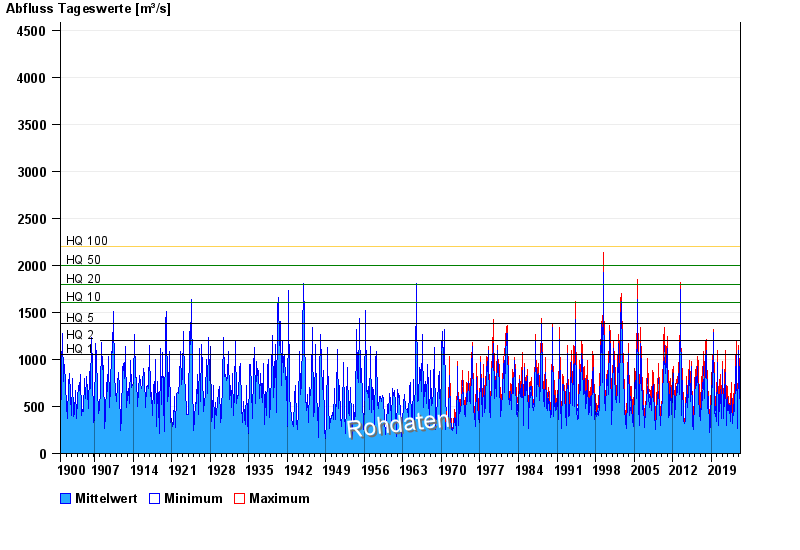
- HQ1 1050 m³/s
- HQ2 1200 m³/s
- HQ5 1380 m³/s
- HQ10 1600 m³/s
- HQ20 1800 m³/s
- HQ50 2000 m³/s
- HQ100 2200 m³/s
| Date | Mean value [m³/s] | Maximum [m³/s] | Minimum [m³/s] |
|---|---|---|---|
| 24.04.2024 | 310 | 322 | 296 |
| 23.04.2024 | 348 | 372 | 322 |
| 22.04.2024 | 374 | 377 | 369 |
| 21.04.2024 | 383 | 407 | 364 |
| 20.04.2024 | 383 | 399 | 372 |
| 19.04.2024 | 385 | 401 | 377 |
| 18.04.2024 | 394 | 410 | 364 |
© Bayerisches Landesamt für Umwelt 2024