
- Start >
- Rivers >
- Discharge >
- Obere Donau >
- Heroldingen >
- Chart of year

Chart of year Heroldingen / Wörnitz
Discharge from 01.04.2018 to 31.03.2019
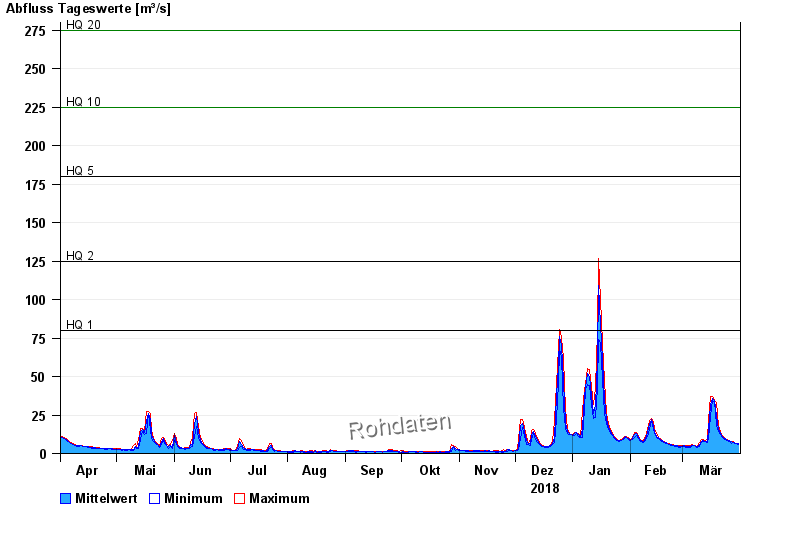
- HQ1 80 m³/s
- HQ2 125 m³/s
- HQ5 180 m³/s
- HQ10 225 m³/s
- HQ20 275 m³/s
- HQ50 345 m³/s
- HQ100 410 m³/s
| Date | Mean value [m³/s] | Maximum [m³/s] | Minimum [m³/s] |
|---|---|---|---|
| 31.03.2019 | 6.22 | 6.6 | 6 |
| 30.03.2019 | 6.54 | 6.75 | 6.3 |
| 29.03.2019 | 6.9 | 7.23 | 6.6 |
| 28.03.2019 | 7.17 | 7.69 | 6.91 |
| 27.03.2019 | 7.65 | 7.86 | 6.75 |
| 26.03.2019 | 8.16 | 8.5 | 7.86 |
| 25.03.2019 | 8.68 | 9 | 8.5 |
© Bayerisches Landesamt für Umwelt 2024