
- Start >
- Rivers >
- Discharge >
- Obere Donau >
- Heroldingen >
- Chart of total period

Chart of total period Heroldingen / Wörnitz
Discharge from 01.11.1978 to 19.04.2024
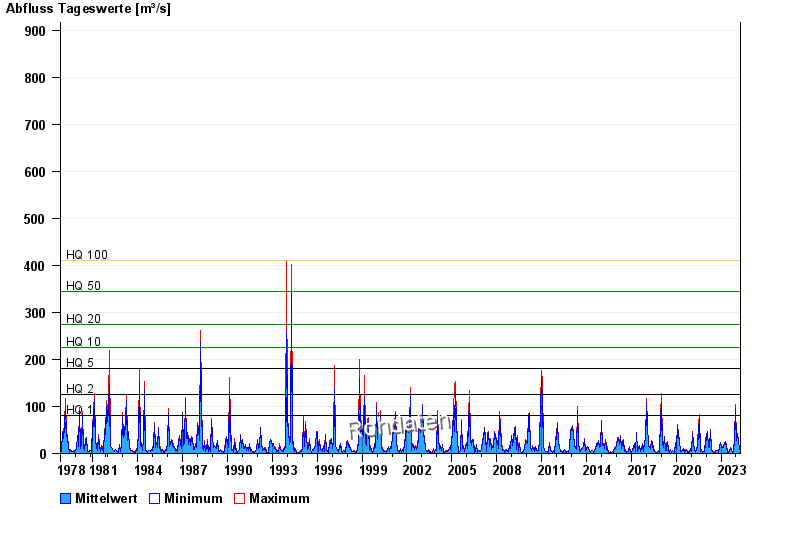
- HQ1 80 m³/s
- HQ2 125 m³/s
- HQ5 180 m³/s
- HQ10 225 m³/s
- HQ20 275 m³/s
- HQ50 345 m³/s
- HQ100 410 m³/s
| Date | Mean value [m³/s] | Maximum [m³/s] | Minimum [m³/s] |
|---|---|---|---|
| 19.04.2024 | 5.02 | 5.23 | 4.8 |
| 18.04.2024 | 5.54 | 6.11 | 5.08 |
| 17.04.2024 | 5.82 | 6.41 | 4.95 |
| 16.04.2024 | 4.38 | 4.8 | 4.11 |
| 15.04.2024 | 4.22 | 4.52 | 3.98 |
| 14.04.2024 | 4.16 | 4.25 | 3.98 |
| 13.04.2024 | 3.99 | 4.66 | 3.2 |
© Bayerisches Landesamt für Umwelt 2024