
- Start >
- Rivers >
- Discharge >
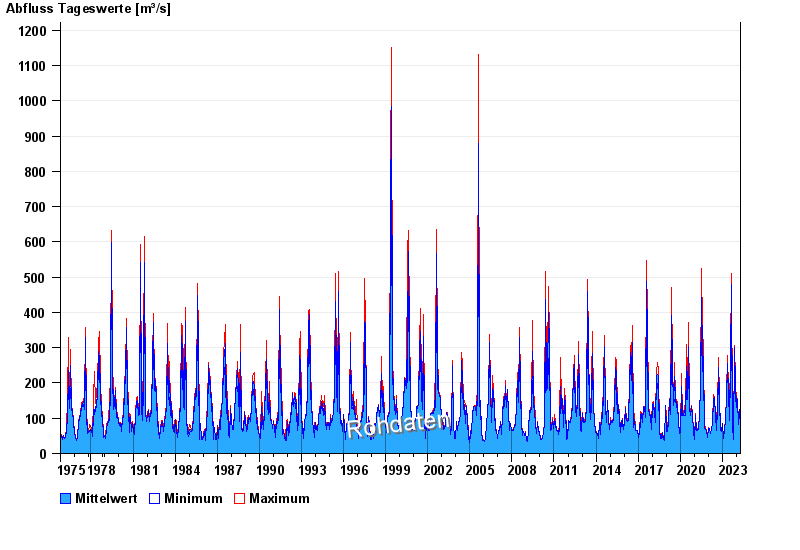
- Obere Donau >
- Haunstetten >
- Chart of total period

Chart of total period Haunstetten / Lech
Discharge from 01.11.1975 to 16.04.2024
| Date | Mean value [m³/s] | Maximum [m³/s] | Minimum [m³/s] |
|---|---|---|---|
| 16.04.2024 | 135 | 135 | 135 |
| 15.04.2024 | 135 | 137 | 135 |
| 14.04.2024 | 135 | 135 | 135 |
| 13.04.2024 | 135 | 135 | 132 |
| 12.04.2024 | 133 | 135 | 132 |
| 11.04.2024 | 118 | 132 | 110 |
| 10.04.2024 | 108 | 110 | 108 |
© Bayerisches Landesamt für Umwelt 2024