
- Start >
- Rivers >
- Discharge >
- Obere Donau >
- Hasberg >
- Chart of total period

Chart of total period Hasberg / Östliche Mindel
Discharge from 01.11.1964 to 17.04.2024
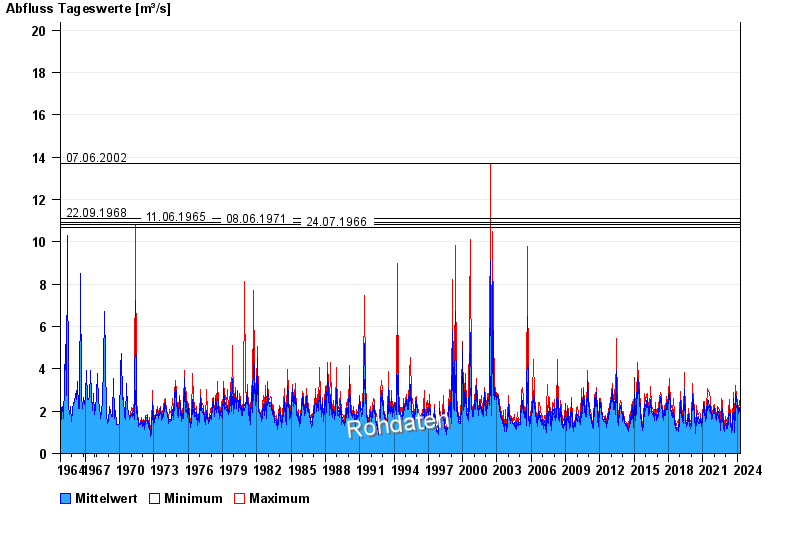
- 07.06.2002 Abfluss: 13,7 m³/s
- 22.09.1968 Abfluss: 11,1 m³/s
- 11.06.1965 Abfluss: 10,9 m³/s
- 08.06.1971 Abfluss: 10,8 m³/s
- 24.07.1966 Abfluss: 10,7 m³/s
| Date | Mean value [m³/s] | Maximum [m³/s] | Minimum [m³/s] |
|---|---|---|---|
| 17.04.2024 | 1.74 | 1.74 | 1.74 |
| 16.04.2024 | 1.74 | 1.84 | 1.54 |
| 15.04.2024 | 1.66 | 1.94 | 1.45 |
| 14.04.2024 | 1.59 | 1.84 | 1.45 |
| 13.04.2024 | 1.64 | 1.64 | 1.54 |
| 12.04.2024 | 1.64 | 1.64 | 1.54 |
| 11.04.2024 | 1.67 | 1.74 | 1.64 |
© Bayerisches Landesamt für Umwelt 2024