
- Start >
- Rivers >
- Discharge >
- Obere Donau >
- Hasberg >
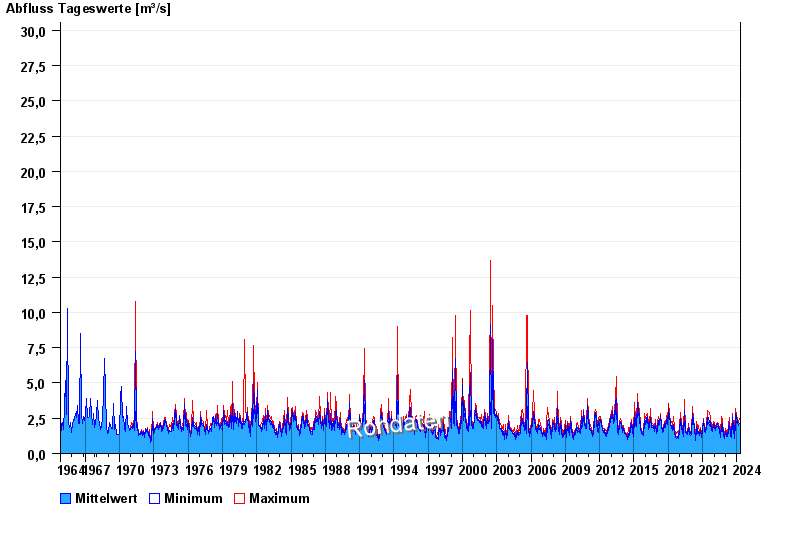
- Chart of total period

Chart of total period Hasberg / Östliche Mindel
Discharge from 01.11.1964 to 25.04.2024
 Für diesen Pegel sind keine Jährlichkeiten hinterlegt.
| Date | Mean value [m³/s] | Maximum [m³/s] | Minimum [m³/s] |
|---|---|---|---|
| 25.04.2024 | 1.84 | 1.84 | 1.84 |
| 24.04.2024 | 1.84 | 1.84 | 1.84 |
| 23.04.2024 | 1.85 | 1.94 | 1.84 |
| 22.04.2024 | 1.96 | 2.05 | 1.84 |
| 21.04.2024 | 2.06 | 2.16 | 2.05 |
| 20.04.2024 | 2.16 | 2.27 | 1.94 |
| 19.04.2024 | 1.84 | 1.94 | 1.64 |
© Bayerisches Landesamt für Umwelt 2024