
- Start >
- Rivers >
- Discharge >
- Obere Donau >
- Harburg >
- Chart of year

Chart of year Harburg / Wörnitz
Discharge from 25.10.2021 to 24.10.2022
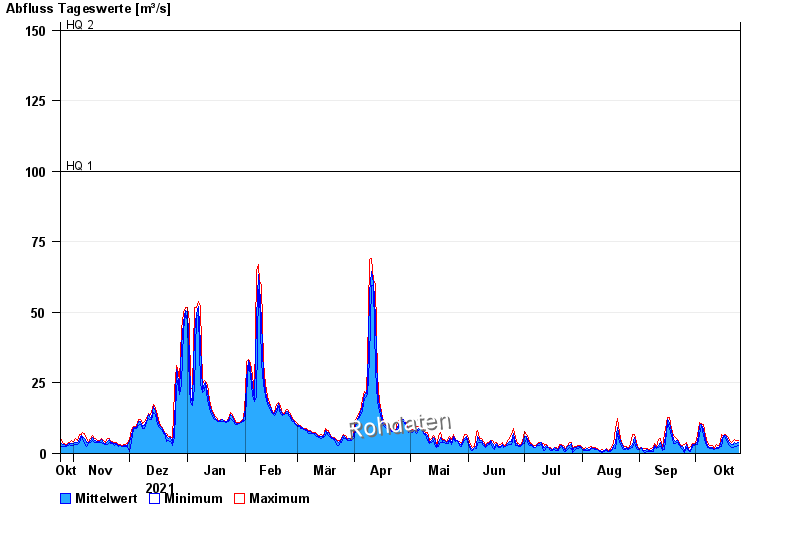
- HQ1 100 m³/s
- HQ2 150 m³/s
- HQ5 220 m³/s
- HQ10 270 m³/s
- HQ20 320 m³/s
- HQ50 395 m³/s
- HQ100 450 m³/s
| Date | Mean value [m³/s] | Maximum [m³/s] | Minimum [m³/s] |
|---|---|---|---|
| 24.10.2022 | 3.86 | 4.7 | 2.76 |
| 23.10.2022 | 3.48 | 4.7 | 2.56 |
| 22.10.2022 | 4.03 | 4.91 | 2.56 |
| 21.10.2022 | 3.24 | 4.48 | 2.16 |
| 20.10.2022 | 3.13 | 3.82 | 1.99 |
| 19.10.2022 | 3.96 | 4.7 | 2.76 |
| 18.10.2022 | 5.06 | 6.03 | 4.04 |
© Bayerisches Landesamt für Umwelt 2024