
- Start >
- Rivers >
- Discharge >
- Obere Donau >
- Harburg >
- Chart of year

Chart of year Harburg / Wörnitz
Discharge from 25.10.2019 to 24.10.2020
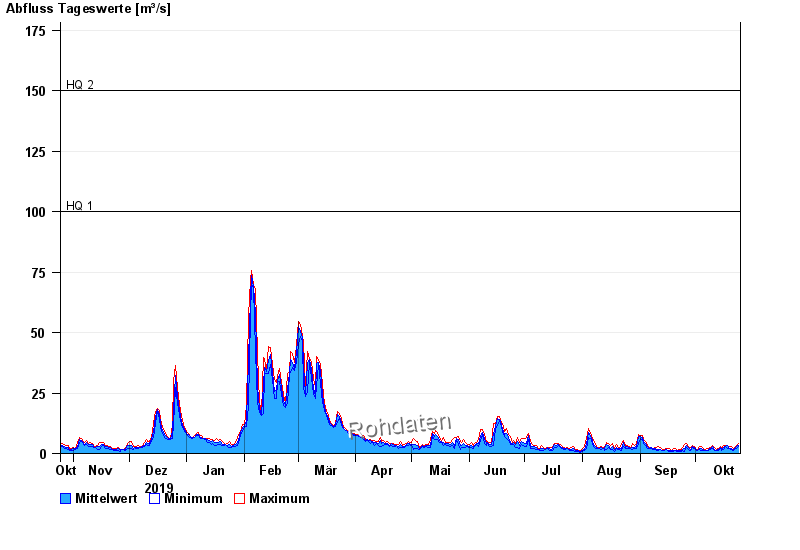
- HQ1 100 m³/s
- HQ2 150 m³/s
- HQ5 220 m³/s
- HQ10 270 m³/s
- HQ20 320 m³/s
- HQ50 395 m³/s
- HQ100 450 m³/s
| Date | Mean value [m³/s] | Maximum [m³/s] | Minimum [m³/s] |
|---|---|---|---|
| 24.10.2020 | 3.48 | 4.14 | 3.07 |
| 23.10.2020 | 2.71 | 3.28 | 2.08 |
| 22.10.2020 | 2.16 | 2.66 | 1.91 |
| 21.10.2020 | 1.65 | 2.08 | 1.35 |
| 20.10.2020 | 2.26 | 3.07 | 1.61 |
| 19.10.2020 | 2.26 | 2.86 | 2.08 |
| 18.10.2020 | 3.19 | 3.5 | 2.26 |
© Bayerisches Landesamt für Umwelt 2024