
- Start >
- Rivers >
- Discharge >
- Obere Donau >
- Gerlenhofen >
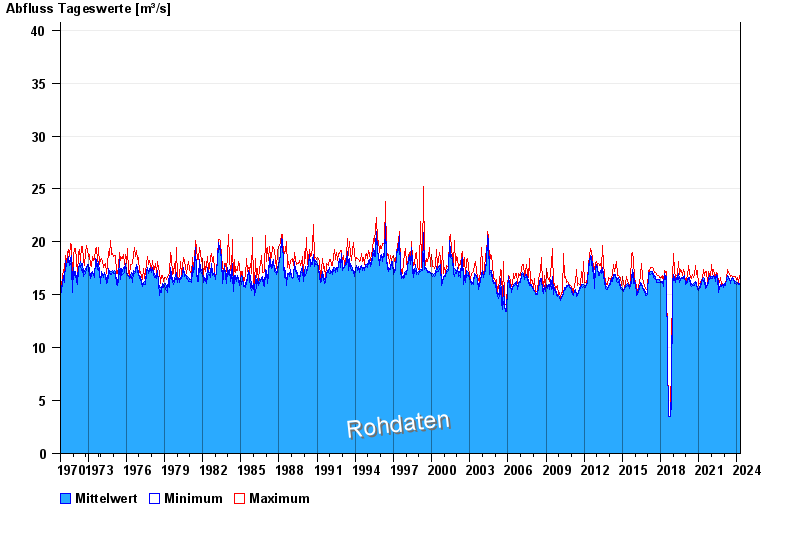
- Chart of total period

Chart of total period Gerlenhofen / Illerkanal
Discharge from 01.11.1970 to 16.04.2024
 Für diesen Pegel sind keine historische Ereignisse hinterlegt.
| Date | Mean value [m³/s] | Maximum [m³/s] | Minimum [m³/s] |
|---|---|---|---|
| 16.04.2024 | 16 | 16 | 15.9 |
| 15.04.2024 | 15.9 | 16 | 15.6 |
| 14.04.2024 | 15.9 | 16 | 15.7 |
| 13.04.2024 | 15.9 | 16 | 15.9 |
| 12.04.2024 | 15.9 | 16 | 15.7 |
| 11.04.2024 | 15.9 | 16 | 15.9 |
| 10.04.2024 | 15.9 | 16 | 15.9 |
© Bayerisches Landesamt für Umwelt 2024