
- Start >
- Rivers >
- Discharge >
- Obere Donau >
- Freising >
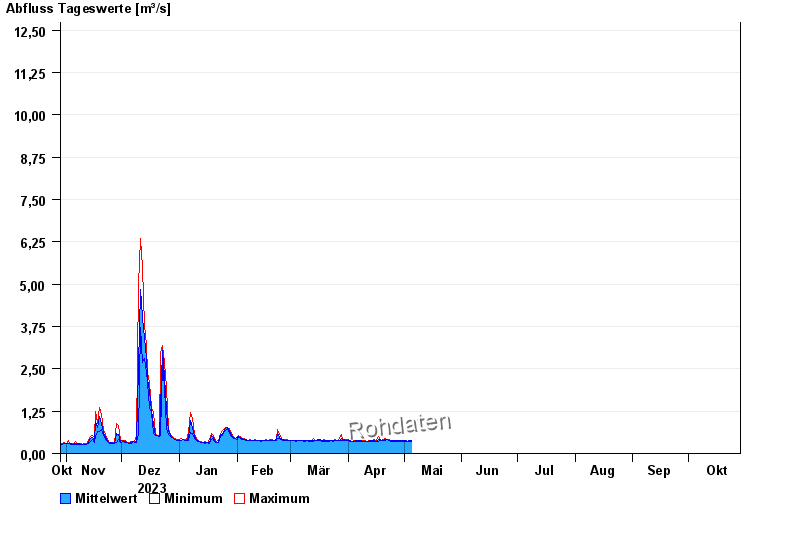
- Chart of year

Chart of year Freising / Schleifermoosach
Discharge from 29.10.2023 to 28.10.2024
 Für diesen Pegel sind keine Jährlichkeiten hinterlegt.
| Date | Mean value [m³/s] | Maximum [m³/s] | Minimum [m³/s] |
|---|---|---|---|
| 25.04.2024 | 0.368 | 0.392 | 0.36 |
| 24.04.2024 | 0.384 | 0.392 | 0.36 |
| 23.04.2024 | 0.396 | 0.424 | 0.392 |
| 22.04.2024 | 0.424 | 0.424 | 0.424 |
| 21.04.2024 | 0.417 | 0.457 | 0.392 |
| 20.04.2024 | 0.395 | 0.424 | 0.392 |
| 19.04.2024 | 0.392 | 0.392 | 0.392 |
© Bayerisches Landesamt für Umwelt 2024