
- Start >
- Rivers >
- Discharge >
- Obere Donau >
- Freising >
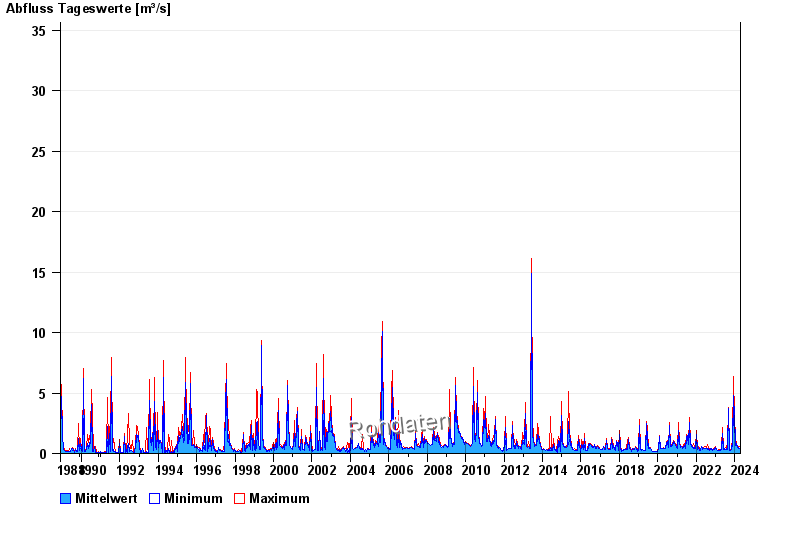
- Chart of total period

Chart of total period Freising / Schleifermoosach
Discharge from 30.11.1988 to 19.04.2024
 Für diesen Pegel sind keine Jährlichkeiten hinterlegt.
| Date | Mean value [m³/s] | Maximum [m³/s] | Minimum [m³/s] |
|---|---|---|---|
| 19.04.2024 | 0.392 | 0.392 | 0.392 |
| 18.04.2024 | 0.4 | 0.424 | 0.392 |
| 17.04.2024 | 0.414 | 0.488 | 0.36 |
| 16.04.2024 | 0.367 | 0.392 | 0.36 |
| 15.04.2024 | 0.383 | 0.424 | 0.36 |
| 14.04.2024 | 0.378 | 0.392 | 0.36 |
| 13.04.2024 | 0.378 | 0.392 | 0.36 |
© Bayerisches Landesamt für Umwelt 2024