
- Start >
- Rivers >
- Discharge >
- Obere Donau >
- Freising >
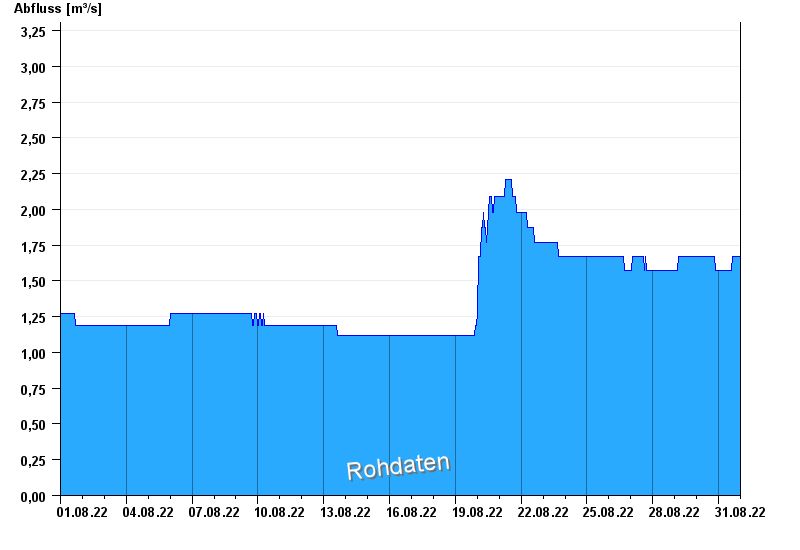
- Chart of month

Chart of month Freising / Moosach
Discharge from 01.08.2022 to 31.08.2022
- 02.06.2013 Abfluss: 11,8 m³/s
- 23.06.1992 Abfluss: 9,24 m³/s
- 31.07.1990 Abfluss: 7,71 m³/s
- 02.02.2013 Abfluss: 7,69 m³/s
- 15.02.1990 Abfluss: 7,36 m³/s
| Date | Runoff [m³/s] |
|---|---|
| 01.09.2022 00:45 | 1.67 |
| 01.09.2022 00:30 | 1.67 |
| 01.09.2022 00:15 | 1.67 |
| 01.09.2022 00:00 | 1.67 |
| 31.08.2022 23:45 | 1.67 |
| 31.08.2022 23:30 | 1.67 |
| 31.08.2022 23:15 | 1.67 |
© Bayerisches Landesamt für Umwelt 2024