
- Start >
- Rivers >
- Discharge >
- Obere Donau >
- Freising >
- Chart of total period

Chart of total period Freising / Isar
Discharge from 01.11.1950 to 17.04.2024
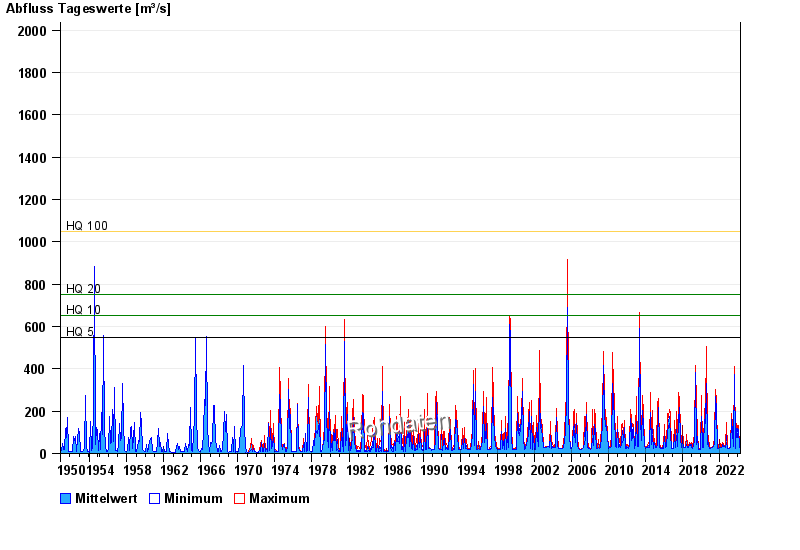
- HQ5 550 m³/s
- HQ10 650 m³/s
- HQ20 750 m³/s
- HQ100 1050 m³/s
| Date | Mean value [m³/s] | Maximum [m³/s] | Minimum [m³/s] |
|---|---|---|---|
| 17.04.2024 | 29.7 | 30.1 | 29.5 |
| 16.04.2024 | 31 | 31.9 | 29.5 |
| 15.04.2024 | 30.9 | 31.9 | 29.5 |
| 14.04.2024 | 30.3 | 31.3 | 29.5 |
| 13.04.2024 | 30.9 | 31.3 | 29.5 |
| 12.04.2024 | 30.6 | 31.3 | 29.5 |
| 11.04.2024 | 30.7 | 31.3 | 30.1 |
© Bayerisches Landesamt für Umwelt 2024