
- Start >
- Rivers >
- Discharge >
- Obere Donau >
- Fischach >
- Chart of year

Chart of year Fischach / Schmutter
Discharge from 01.01.2024 to 24.04.2024
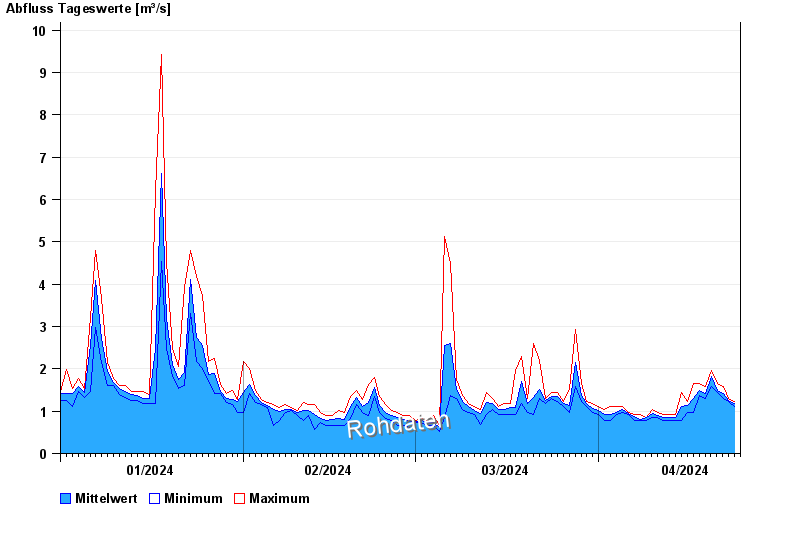
| Date | Mean value [m³/s] | Maximum [m³/s] | Minimum [m³/s] |
|---|---|---|---|
| 24.04.2024 | 1.17 | 1.23 | 1.1 |
| 23.04.2024 | 1.25 | 1.3 | 1.23 |
| 22.04.2024 | 1.42 | 1.59 | 1.3 |
| 21.04.2024 | 1.49 | 1.66 | 1.44 |
| 20.04.2024 | 1.83 | 1.96 | 1.59 |
| 19.04.2024 | 1.42 | 1.59 | 1.3 |
| 18.04.2024 | 1.48 | 1.66 | 1.37 |
© Bayerisches Landesamt für Umwelt 2024