
- Start >
- Rivers >
- Discharge >
- Obere Donau >
- Fischach >
- Chart of total period

Chart of total period Fischach / Schmutter
Discharge from 01.11.1950 to 19.04.2024
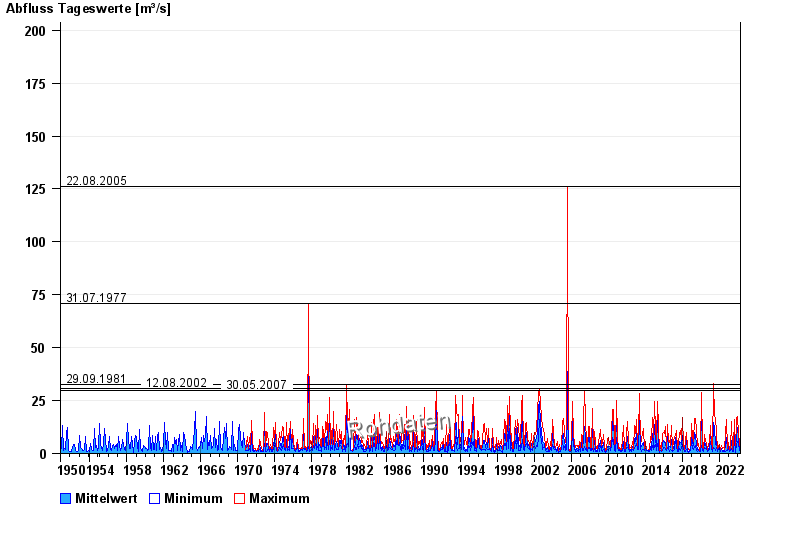
- 22.08.2005 Abfluss: 126 m³/s
- 31.07.1977 Abfluss: 70,8 m³/s
- 29.09.1981 Abfluss: 32,8 m³/s
- 12.08.2002 Abfluss: 30,9 m³/s
- 30.05.2007 Abfluss: 29,6 m³/s
| Date | Mean value [m³/s] | Maximum [m³/s] | Minimum [m³/s] |
|---|---|---|---|
| 19.04.2024 | 1.41 | 1.59 | 1.3 |
| 18.04.2024 | 1.48 | 1.66 | 1.37 |
| 17.04.2024 | 1.29 | 1.66 | 0.971 |
| 16.04.2024 | 1.14 | 1.23 | 0.971 |
| 15.04.2024 | 1.11 | 1.44 | 0.79 |
| 14.04.2024 | 0.853 | 0.913 | 0.79 |
| 13.04.2024 | 0.854 | 0.913 | 0.79 |
© Bayerisches Landesamt für Umwelt 2024