
- Start >
- Rivers >
- Discharge >
- Obere Donau >
- Eichstätt >
- Chart of year

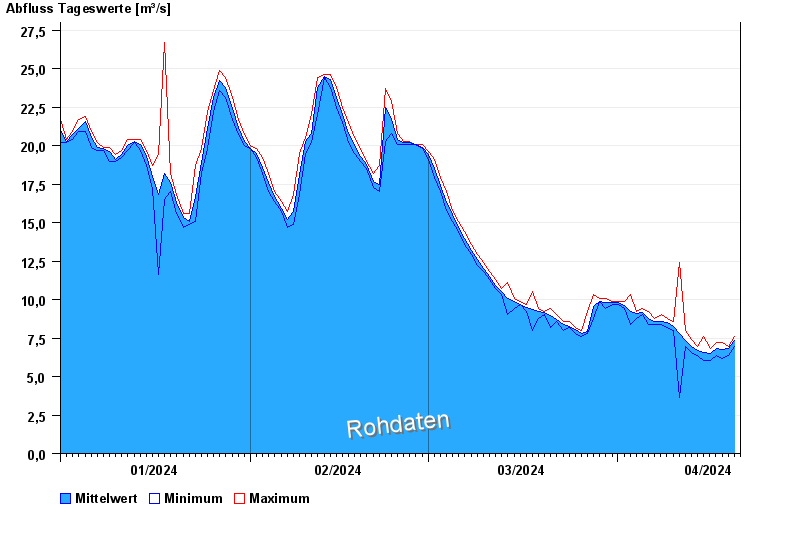
Chart of year Eichstätt / Altmühl
Discharge from 01.01.2024 to 20.04.2024
| Date | Mean value [m³/s] | Maximum [m³/s] | Minimum [m³/s] |
|---|---|---|---|
| 20.04.2024 | 7.15 | 7.18 | 6.98 |
| 19.04.2024 | 6.82 | 6.98 | 6.39 |
| 18.04.2024 | 6.74 | 7.18 | 6.2 |
| 17.04.2024 | 6.8 | 7.18 | 6.39 |
| 16.04.2024 | 6.51 | 6.79 | 6.01 |
| 15.04.2024 | 6.55 | 7.59 | 6.01 |
| 14.04.2024 | 6.72 | 6.98 | 6.39 |
© Bayerisches Landesamt für Umwelt 2024