
- Start >
- Rivers >
- Discharge >
- Obere Donau >
- Dasing >
- Chart of year

Chart of year Dasing / Paar
Discharge from 01.01.2024 to 25.04.2024
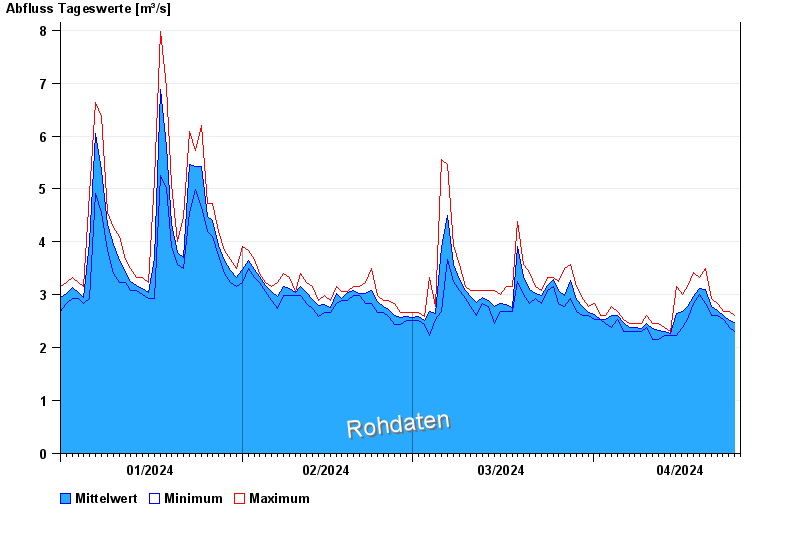
| Date | Mean value [m³/s] | Maximum [m³/s] | Minimum [m³/s] |
|---|---|---|---|
| 25.04.2024 | 2.53 | 2.61 | 2.45 |
| 24.04.2024 | 2.51 | 2.69 | 2.38 |
| 23.04.2024 | 2.61 | 2.69 | 2.53 |
| 22.04.2024 | 2.7 | 2.84 | 2.61 |
| 21.04.2024 | 2.78 | 2.92 | 2.61 |
| 20.04.2024 | 3.1 | 3.5 | 2.84 |
| 19.04.2024 | 3.12 | 3.33 | 3.01 |
© Bayerisches Landesamt für Umwelt 2024