
- Start >
- Rivers >
- Discharge >
- Obere Donau >
- Blumenthal >
- Chart of year

Chart of year Blumenthal / Ecknach
Discharge from 24.08.2019 to 23.08.2020
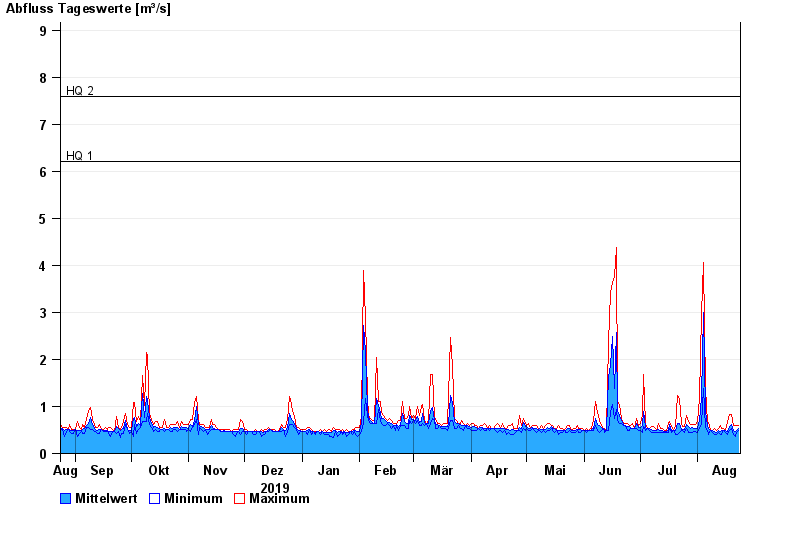
- HQ1 6,2 m³/s
- HQ2 7,6 m³/s
- HQ5 10 m³/s
- HQ10 13 m³/s
- HQ20 16,5 m³/s
- HQ50 21 m³/s
- HQ100 25 m³/s
| Date | Mean value [m³/s] | Maximum [m³/s] | Minimum [m³/s] |
|---|---|---|---|
| 23.08.2020 | 0.533 | 0.588 | 0.484 |
| 22.08.2020 | 0.491 | 0.588 | 0.44 |
| 21.08.2020 | 0.463 | 0.588 | 0.358 |
| 20.08.2020 | 0.493 | 0.588 | 0.395 |
| 19.08.2020 | 0.623 | 0.825 | 0.533 |
| 18.08.2020 | 0.573 | 0.825 | 0.491 |
| 17.08.2020 | 0.462 | 0.65 | 0.4 |
© Bayerisches Landesamt für Umwelt 2024