
- Start >
- Rivers >
- Discharge >
- Obere Donau >
- Blumenthal >
- Chart of year

Chart of year Blumenthal / Ecknach
Discharge from 21.08.2020 to 20.08.2021
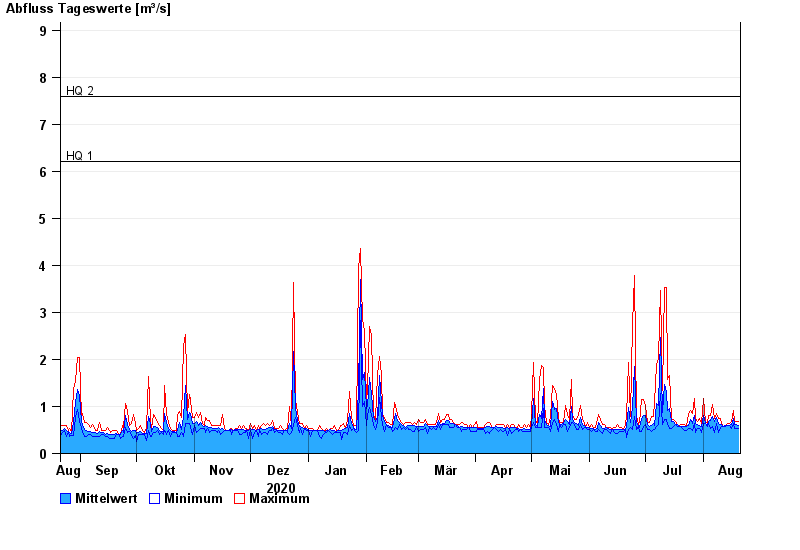
- HQ1 6,2 m³/s
- HQ2 7,6 m³/s
- HQ5 10 m³/s
- HQ10 13 m³/s
- HQ20 16,5 m³/s
- HQ50 21 m³/s
- HQ100 25 m³/s
| Date | Mean value [m³/s] | Maximum [m³/s] | Minimum [m³/s] |
|---|---|---|---|
| 20.08.2021 | 0.601 | 0.69 | 0.537 |
| 19.08.2021 | 0.626 | 0.689 | 0.536 |
| 18.08.2021 | 0.627 | 0.689 | 0.536 |
| 17.08.2021 | 0.735 | 0.924 | 0.637 |
| 16.08.2021 | 0.613 | 0.688 | 0.535 |
| 15.08.2021 | 0.596 | 0.637 | 0.585 |
| 14.08.2021 | 0.589 | 0.636 | 0.585 |
© Bayerisches Landesamt für Umwelt 2024