
- Start >
- Rivers >
- Discharge >
- Obere Donau >
- Binzwangen >
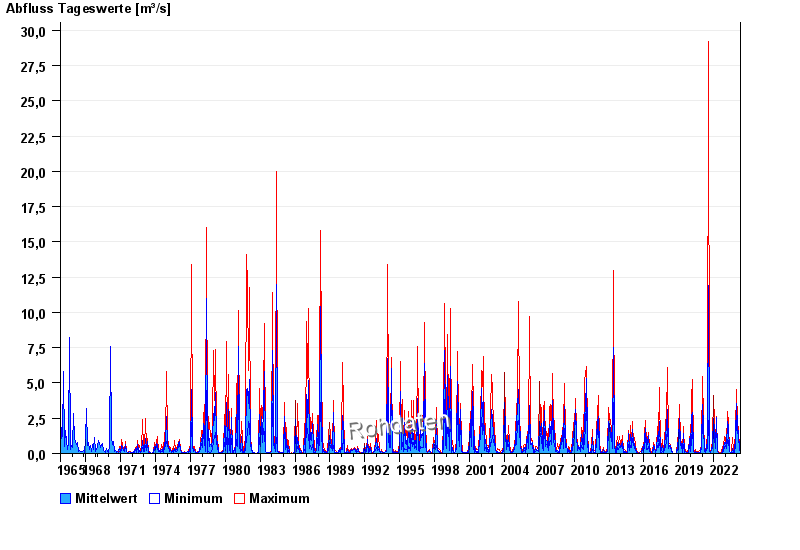
- Chart of total period

Chart of total period Binzwangen / Altmühl
Discharge from 01.11.1965 to 20.04.2024
note
Wasserstand und Abfluss wird zeitweise durch Biberdamm beeinflusst.
| Date | Mean value [m³/s] | Maximum [m³/s] | Minimum [m³/s] |
|---|---|---|---|
| 20.04.2024 | 0.168 | 0.173 | 0.161 |
| 19.04.2024 | 0.087 | 0.161 | 0.067 |
| 18.04.2024 | 0.074 | 0.082 | 0.074 |
| 17.04.2024 | 0.097 | 0.139 | 0.082 |
| 16.04.2024 | 0.077 | 0.109 | 0.059 |
| 15.04.2024 | 0.059 | 0.059 | 0.059 |
| 14.04.2024 | 0.066 | 0.067 | 0.059 |
© Bayerisches Landesamt für Umwelt 2024