
- Start >
- Rivers >
- Discharge >
- Obere Donau >
- Berg >
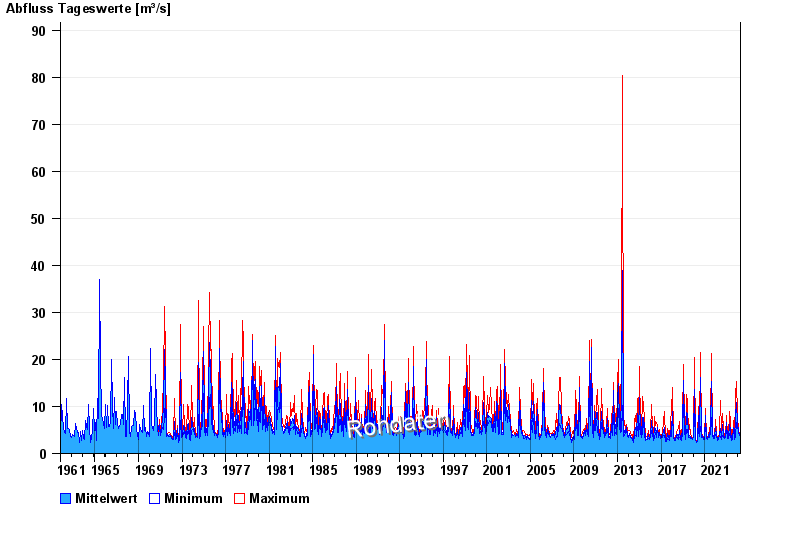
- Chart of total period

Chart of total period Berg / Sempt
Discharge from 01.11.1961 to 19.04.2024
| Date | Mean value [m³/s] | Maximum [m³/s] | Minimum [m³/s] |
|---|---|---|---|
| 19.04.2024 | 3.9 | 3.93 | 3.84 |
| 18.04.2024 | 3.91 | 3.93 | 3.84 |
| 17.04.2024 | 3.89 | 3.93 | 3.74 |
| 16.04.2024 | 3.8 | 3.84 | 3.74 |
| 15.04.2024 | 3.83 | 4.04 | 3.64 |
| 14.04.2024 | 3.73 | 3.74 | 3.64 |
| 13.04.2024 | 3.69 | 3.74 | 3.64 |
© Bayerisches Landesamt für Umwelt 2024