
- Start >
- Rivers >
- Discharge >
- Obere Donau >
- Bächingen >
- Chart of total period

Chart of total period Bächingen / Brenz
Discharge from 01.11.1979 to 19.04.2024
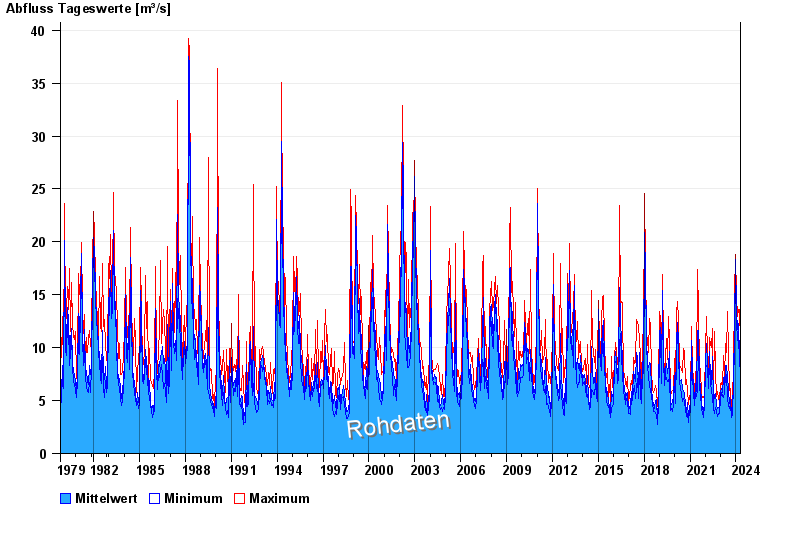
| Date | Mean value [m³/s] | Maximum [m³/s] | Minimum [m³/s] |
|---|---|---|---|
| 19.04.2024 | 8.04 | 10.4 | 6.91 |
| 18.04.2024 | 7.85 | 9.82 | 6.91 |
| 17.04.2024 | 8.15 | 8.7 | 7.65 |
| 16.04.2024 | 7.75 | 8.17 | 7.4 |
| 15.04.2024 | 7.9 | 8.43 | 7.4 |
| 14.04.2024 | 7.79 | 8.17 | 7.4 |
| 13.04.2024 | 7.76 | 8.7 | 6.91 |
© Bayerisches Landesamt für Umwelt 2024