
- Start >
- Rivers >
- Discharge >
- Obere Donau >
- Aunkofen >
- Chart of year

Chart of year Aunkofen / Abens
Discharge from 22.09.2019 to 21.09.2020
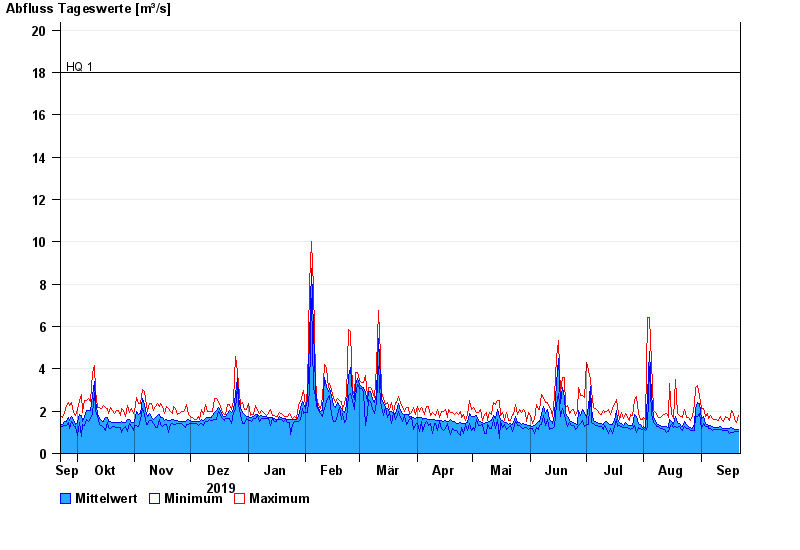
- HQ1 18 m³/s
- HQ2 27 m³/s
- HQ5 43 m³/s
- HQ10 58 m³/s
- HQ20 75 m³/s
- HQ50 105 m³/s
- HQ100 135 m³/s
| Date | Mean value [m³/s] | Maximum [m³/s] | Minimum [m³/s] |
|---|---|---|---|
| 21.09.2020 | 1.15 | 1.79 | 1.04 |
| 20.09.2020 | 1.14 | 1.45 | 1.04 |
| 19.09.2020 | 1.15 | 1.51 | 1.04 |
| 18.09.2020 | 1.19 | 1.85 | 0.983 |
| 17.09.2020 | 1.22 | 2.01 | 0.981 |
| 16.09.2020 | 1.16 | 1.57 | 0.93 |
| 15.09.2020 | 1.16 | 1.7 | 1.08 |
© Bayerisches Landesamt für Umwelt 2024