
- Start >
- Rivers >
- Discharge >
- Obere Donau >
- Appolding >
- Chart of year

Chart of year Appolding / Strogen
Discharge from 18.09.2021 to 17.09.2022
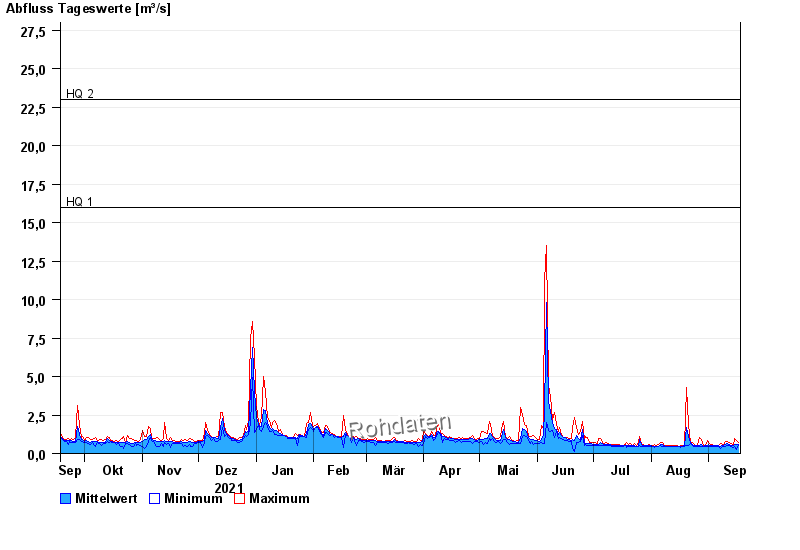
- HQ1 16 m³/s
- HQ2 23 m³/s
- HQ5 31 m³/s
- HQ10 38 m³/s
- HQ20 45 m³/s
- HQ50 57 m³/s
- HQ100 65 m³/s
| Date | Mean value [m³/s] | Maximum [m³/s] | Minimum [m³/s] |
|---|---|---|---|
| 17.09.2022 | 0.608 | 0.725 | 0.497 |
| 16.09.2022 | 0.602 | 0.831 | 0.288 |
| 15.09.2022 | 0.615 | 0.945 | 0.458 |
| 14.09.2022 | 0.499 | 0.538 | 0.42 |
| 13.09.2022 | 0.515 | 0.626 | 0.458 |
| 12.09.2022 | 0.606 | 0.725 | 0.497 |
| 11.09.2022 | 0.642 | 0.775 | 0.538 |
© Bayerisches Landesamt für Umwelt 2024