
- Start >
- Rivers >
- Discharge >
- Obere Donau >
- Appolding >
- Chart of year

Chart of year Appolding / Strogen
Discharge from 01.01.2019 to 31.12.2019
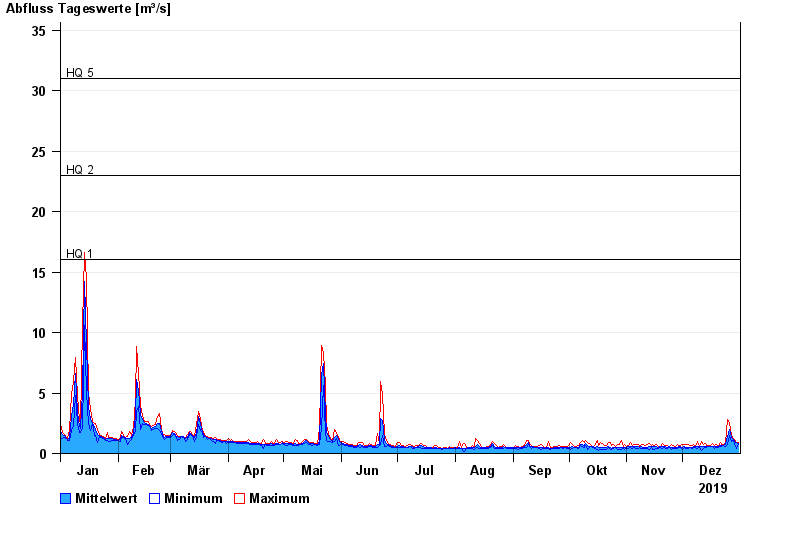
- HQ1 16 m³/s
- HQ2 23 m³/s
- HQ5 31 m³/s
- HQ10 38 m³/s
- HQ20 45 m³/s
- HQ50 57 m³/s
- HQ100 65 m³/s
| Date | Mean value [m³/s] | Maximum [m³/s] | Minimum [m³/s] |
|---|---|---|---|
| 31.12.2019 | 0.818 | 0.882 | 0.768 |
| 30.12.2019 | 0.871 | 0.911 | 0.402 |
| 29.12.2019 | 0.992 | 1.12 | 0.821 |
| 28.12.2019 | 1.17 | 1.28 | 1.07 |
| 27.12.2019 | 1.3 | 1.52 | 1 |
| 26.12.2019 | 1.97 | 2.53 | 1.51 |
| 25.12.2019 | 1.38 | 2.82 | 0.758 |
© Bayerisches Landesamt für Umwelt 2024