
- Start >
- Rivers >
- Discharge >
- Obere Donau >
- Aha >
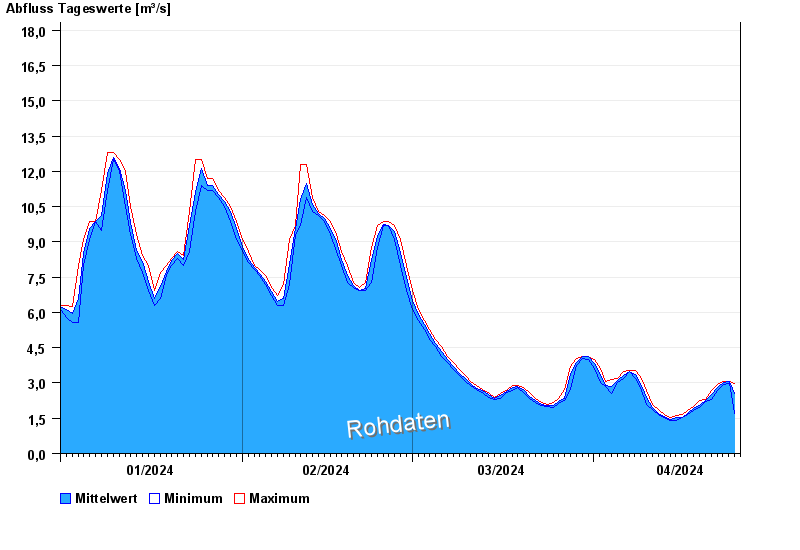
- Chart of year

Chart of year Aha / Altmühl
Discharge from 01.01.2024 to 25.04.2024
- 17.03.1988 Abfluss: 147 m³/s
- 14.04.1994 Abfluss: 123 m³/s
- 21.12.1993 Abfluss: 115 m³/s
- 03.03.1987 Abfluss: 97,6 m³/s
- 01.02.1982 Abfluss: 73,4 m³/s
| Date | Mean value [m³/s] | Maximum [m³/s] | Minimum [m³/s] |
|---|---|---|---|
| 25.04.2024 | 2.91 | 2.98 | 2.88 |
| 24.04.2024 | 3.05 | 3.08 | 2.98 |
| 23.04.2024 | 3.01 | 3.08 | 2.93 |
| 22.04.2024 | 2.81 | 2.93 | 2.7 |
| 21.04.2024 | 2.5 | 2.7 | 2.3 |
| 20.04.2024 | 2.26 | 2.3 | 2.21 |
| 19.04.2024 | 2.06 | 2.26 | 1.95 |
© Bayerisches Landesamt für Umwelt 2024