

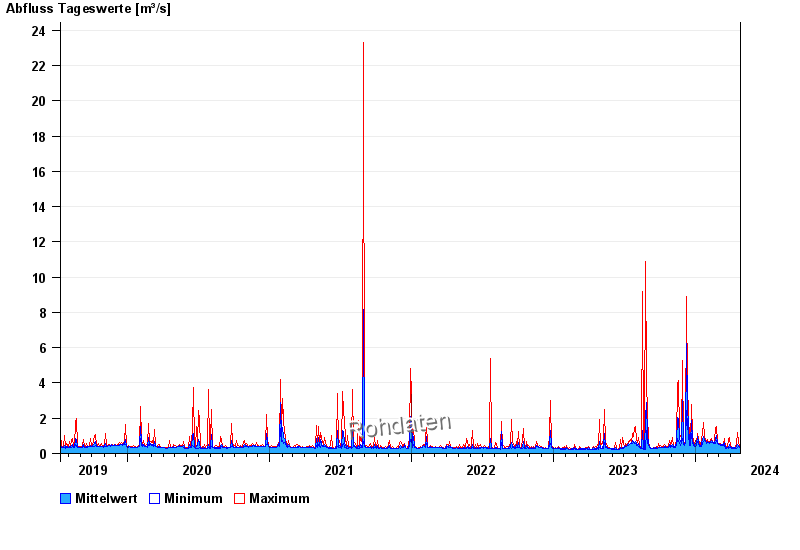
Chart of total period Wolnzach / Wolnzach
Discharge from 12.07.2019 to 25.04.2024
 Für diesen Pegel sind keine -Sommer hinterlegt.
| Date | Mean value [m³/s] | Maximum [m³/s] | Minimum [m³/s] |
|---|---|---|---|
| 25.04.2024 | 0.356 | 0.364 | 0.336 |
| 24.04.2024 | 0.351 | 0.364 | 0.336 |
| 23.04.2024 | 0.371 | 0.392 | 0.364 |
| 22.04.2024 | 0.472 | 0.622 | 0.392 |
| 21.04.2024 | 0.392 | 0.586 | 0.336 |
| 20.04.2024 | 0.371 | 0.392 | 0.336 |
| 19.04.2024 | 0.372 | 0.422 | 0.336 |
© Bayerisches Landesamt für Umwelt 2024