
- Start >
- Rivers >
- Discharge >
- Isar >
- Wernleiten >
- Chart of total period

Chart of total period Wernleiten / Rote Traun
Discharge from 01.11.1925 to 16.04.2024
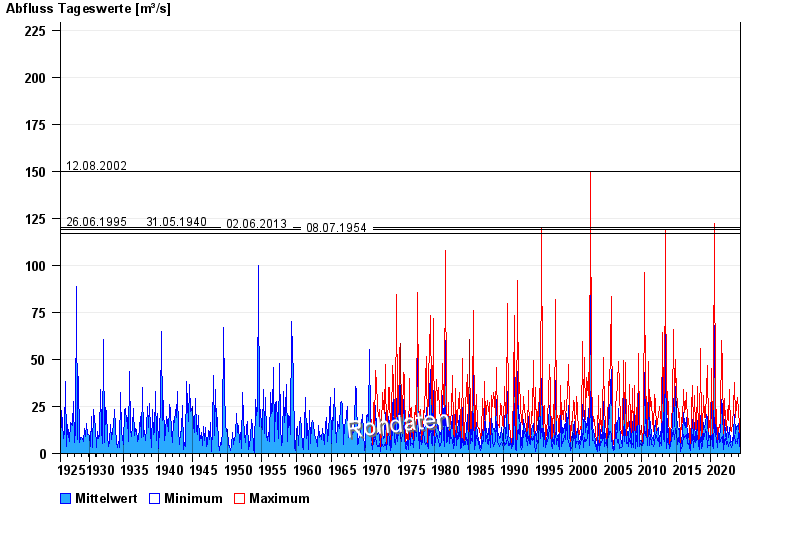
- 12.08.2002 Abfluss: 150 m³/s
- 26.06.1995 Abfluss: 120 m³/s
- 31.05.1940 Abfluss: 120 m³/s
- 02.06.2013 Abfluss: 119 m³/s
- 08.07.1954 Abfluss: 117 m³/s
| Date | Mean value [m³/s] | Maximum [m³/s] | Minimum [m³/s] |
|---|---|---|---|
| 16.04.2024 | 1.22 | 1.24 | 1.16 |
| 15.04.2024 | 1.16 | 1.99 | 0.882 |
| 14.04.2024 | 1.07 | 1.24 | 0.944 |
| 13.04.2024 | 1.09 | 1.16 | 0.944 |
| 12.04.2024 | 1.14 | 1.24 | 1.08 |
| 11.04.2024 | 1.27 | 1.41 | 1.16 |
| 10.04.2024 | 1.52 | 2.11 | 1.16 |
© Bayerisches Landesamt für Umwelt 2024