

Chart of year Weg / Isen
Discharge from 20.04.2021 to 19.04.2022
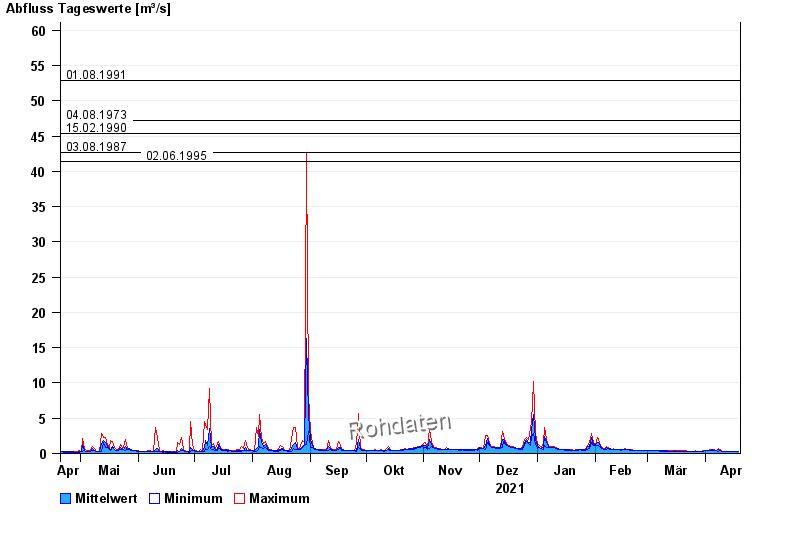
- 01.08.1991 Abfluss: 52,8 m³/s
- 04.08.1973 Abfluss: 47,2 m³/s
- 15.02.1990 Abfluss: 45,3 m³/s
- 03.08.1987 Abfluss: 42,6 m³/s
- 02.06.1995 Abfluss: 41,4 m³/s
| Date | Mean value [m³/s] | Maximum [m³/s] | Minimum [m³/s] |
|---|---|---|---|
| 19.04.2022 | 0.244 | 0.258 | 0.227 |
| 18.04.2022 | 0.25 | 0.273 | 0.227 |
| 17.04.2022 | 0.249 | 0.258 | 0.227 |
| 16.04.2022 | 0.257 | 0.288 | 0.242 |
| 15.04.2022 | 0.267 | 0.288 | 0.258 |
| 14.04.2022 | 0.27 | 0.288 | 0.242 |
| 13.04.2022 | 0.281 | 0.303 | 0.273 |
© Bayerisches Landesamt für Umwelt 2024