

Chart of year Weg / Isen
Discharge from 21.09.2022 to 20.09.2023
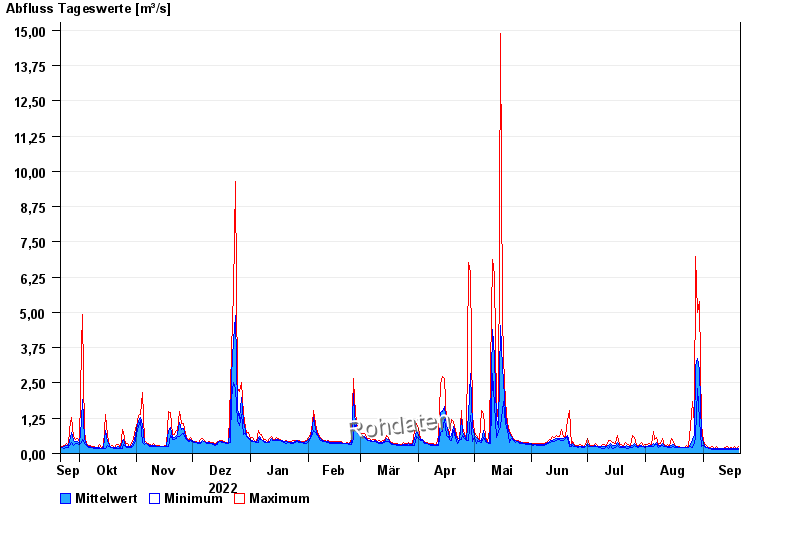
| Date | Mean value [m³/s] | Maximum [m³/s] | Minimum [m³/s] |
|---|---|---|---|
| 20.09.2023 | 0.163 | 0.236 | 0.158 |
| 19.09.2023 | 0.169 | 0.191 | 0.158 |
| 18.09.2023 | 0.17 | 0.261 | 0.146 |
| 17.09.2023 | 0.16 | 0.191 | 0.127 |
| 16.09.2023 | 0.165 | 0.202 | 0.136 |
| 15.09.2023 | 0.166 | 0.18 | 0.158 |
| 14.09.2023 | 0.186 | 0.236 | 0.146 |
© Bayerisches Landesamt für Umwelt 2024