

Chart of year Weg / Isen
Discharge from 01.01.2021 to 31.12.2021
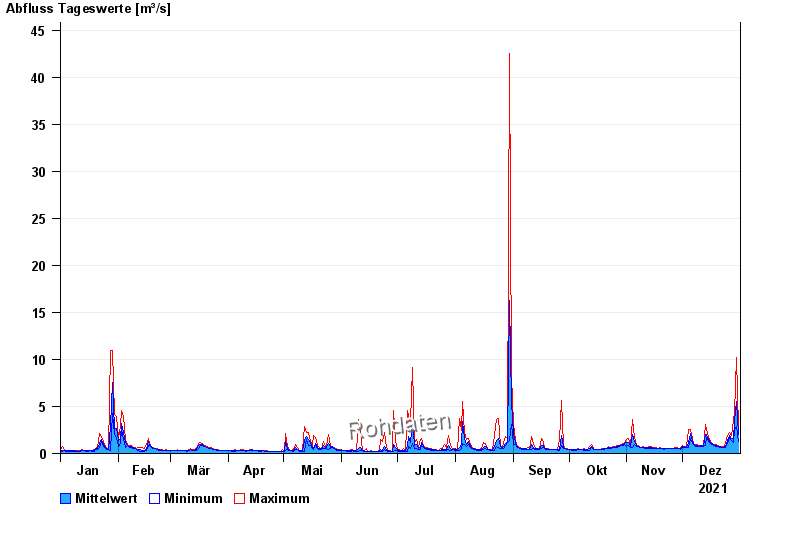
| Date | Mean value [m³/s] | Maximum [m³/s] | Minimum [m³/s] |
|---|---|---|---|
| 31.12.2021 | 2 | 2.8 | 1.25 |
| 30.12.2021 | 5.51 | 10.2 | 2.87 |
| 29.12.2021 | 3.39 | 4.41 | 2.46 |
| 28.12.2021 | 1.62 | 3.52 | 1.14 |
| 27.12.2021 | 1.61 | 1.92 | 1.37 |
| 26.12.2021 | 1.94 | 2.25 | 1.73 |
| 25.12.2021 | 1.41 | 1.92 | 1.09 |
© Bayerisches Landesamt für Umwelt 2024