

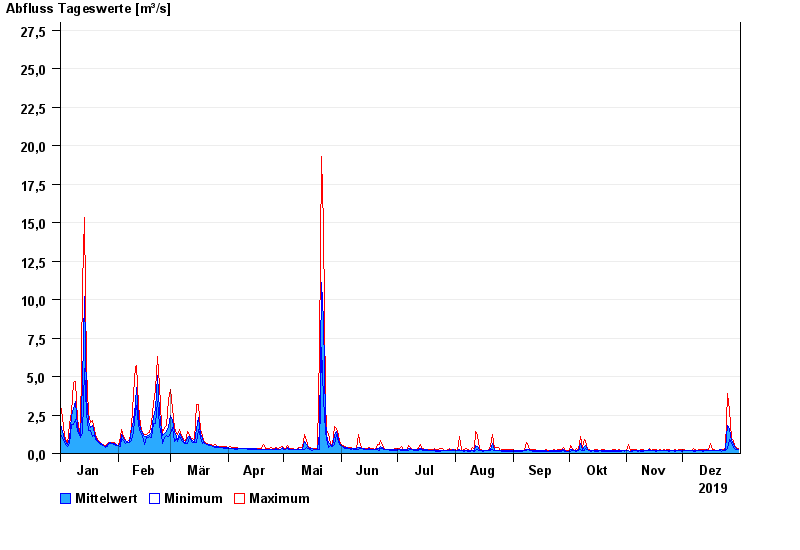
Chart of year Weg / Isen
Discharge from 01.01.2019 to 31.12.2019
- 01.08.1991 Abfluss: 52,8 m³/s
- 04.08.1973 Abfluss: 47,2 m³/s
- 15.02.1990 Abfluss: 45,3 m³/s
- 03.08.1987 Abfluss: 42,6 m³/s
- 02.06.1995 Abfluss: 41,4 m³/s
| Date | Mean value [m³/s] | Maximum [m³/s] | Minimum [m³/s] |
|---|---|---|---|
| 31.12.2019 | 0.281 | 0.306 | 0.262 |
| 30.12.2019 | 0.329 | 0.381 | 0.287 |
| 29.12.2019 | 0.442 | 0.537 | 0.353 |
| 28.12.2019 | 0.659 | 0.872 | 0.372 |
| 27.12.2019 | 0.874 | 0.989 | 0.728 |
| 26.12.2019 | 1.58 | 2.78 | 0.886 |
| 25.12.2019 | 1.81 | 3.87 | 0.331 |
© Bayerisches Landesamt für Umwelt 2024