

Chart of total period Valley / Mangfall
Discharge from 04.11.1939 to 20.04.2024
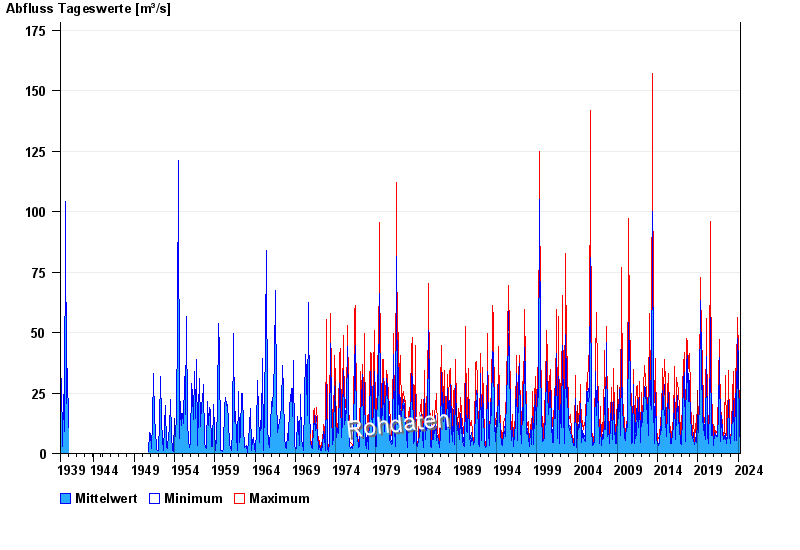
| Date | Mean value [m³/s] | Maximum [m³/s] | Minimum [m³/s] |
|---|---|---|---|
| 20.04.2024 | 4.93 | 5.2 | 4.72 |
| 19.04.2024 | 4.5 | 4.72 | 4.27 |
| 18.04.2024 | 4.34 | 4.5 | 4.27 |
| 17.04.2024 | 4.13 | 4.27 | 4.06 |
| 16.04.2024 | 4.14 | 4.27 | 4.06 |
| 15.04.2024 | 4.31 | 4.5 | 4.27 |
| 14.04.2024 | 6.48 | 6.76 | 4.5 |
© Bayerisches Landesamt für Umwelt 2024