

Chart of total period Unverzug / Götzinger Achen
Discharge from 01.11.1925 to 25.04.2024
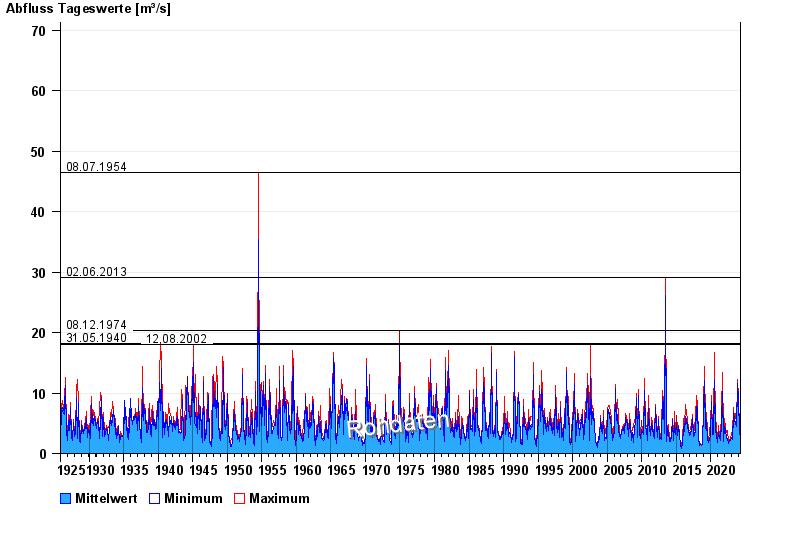
- 08.07.1954 Abfluss: 46,4 m³/s
- 02.06.2013 Abfluss: 29,1 m³/s
- 08.12.1974 Abfluss: 20,3 m³/s
- 31.05.1940 Abfluss: 18,2 m³/s
- 12.08.2002 Abfluss: 18 m³/s
| Date | Mean value [m³/s] | Maximum [m³/s] | Minimum [m³/s] |
|---|---|---|---|
| 25.04.2024 | 2.36 | 2.36 | 2.36 |
| 24.04.2024 | 2.35 | 2.36 | 2.25 |
| 23.04.2024 | 2.25 | 2.36 | 2.25 |
| 22.04.2024 | 2.33 | 2.36 | 2.25 |
| 21.04.2024 | 2.08 | 2.25 | 2.03 |
| 20.04.2024 | 1.94 | 2.03 | 1.92 |
| 19.04.2024 | 1.82 | 1.92 | 1.82 |
© Bayerisches Landesamt für Umwelt 2024