

Chart of year Unternogg / Halbammer
Discharge from 18.10.2021 to 17.10.2022
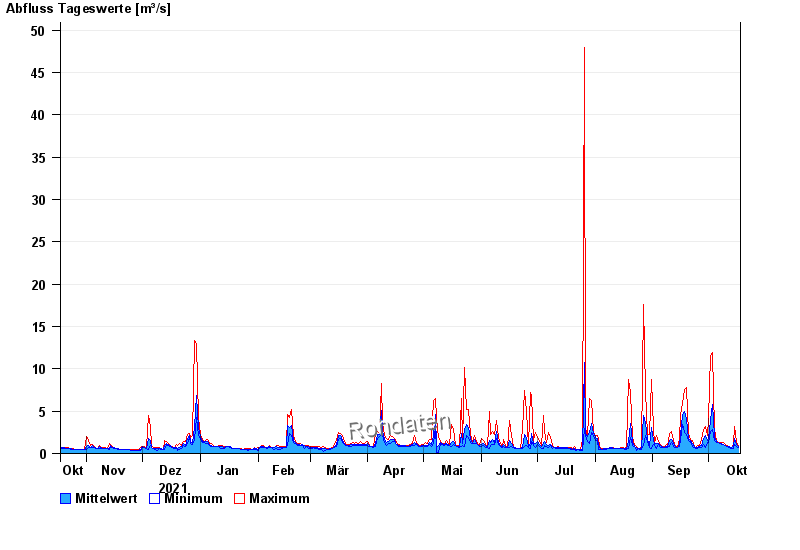
| Date | Mean value [m³/s] | Maximum [m³/s] | Minimum [m³/s] |
|---|---|---|---|
| 17.10.2022 | 0.805 | 0.881 | 0.762 |
| 16.10.2022 | 1.07 | 1.25 | 0.881 |
| 15.10.2022 | 1.76 | 3.22 | 1.09 |
| 14.10.2022 | 0.825 | 1.09 | 0.61 |
| 13.10.2022 | 0.744 | 0.762 | 0.61 |
| 12.10.2022 | 0.796 | 0.819 | 0.762 |
| 11.10.2022 | 0.883 | 0.945 | 0.819 |
© Bayerisches Landesamt für Umwelt 2024