

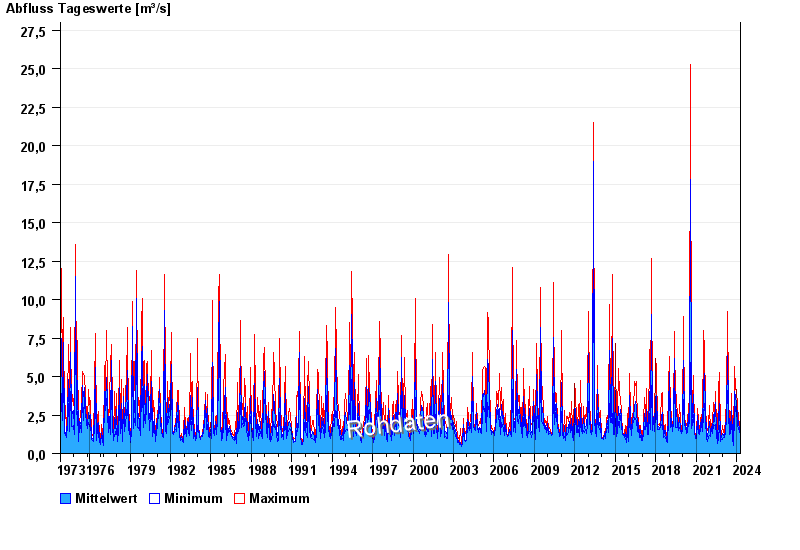
Chart of total period Übersee / Überseer Bach
Discharge from 01.11.1973 to 19.04.2024
note
Datenabruf nur 07:00, 15:00 und 23:00 MEZ
| Date | Mean value [m³/s] | Maximum [m³/s] | Minimum [m³/s] |
|---|---|---|---|
| 19.04.2024 | 1.36 | 1.57 | 1.12 |
| 18.04.2024 | 1.3 | 1.43 | 1.24 |
| 17.04.2024 | 1.18 | 1.43 | 1.06 |
| 16.04.2024 | 1.07 | 1.5 | 0.755 |
| 15.04.2024 | 1.08 | 1.18 | 1.01 |
| 14.04.2024 | 1.02 | 1.06 | 1.01 |
| 13.04.2024 | 1.04 | 1.06 | 1.01 |
© Bayerisches Landesamt für Umwelt 2024