

Chart of total period Trostberg / Alzkanal
Discharge from 01.11.1969 to 25.04.2024
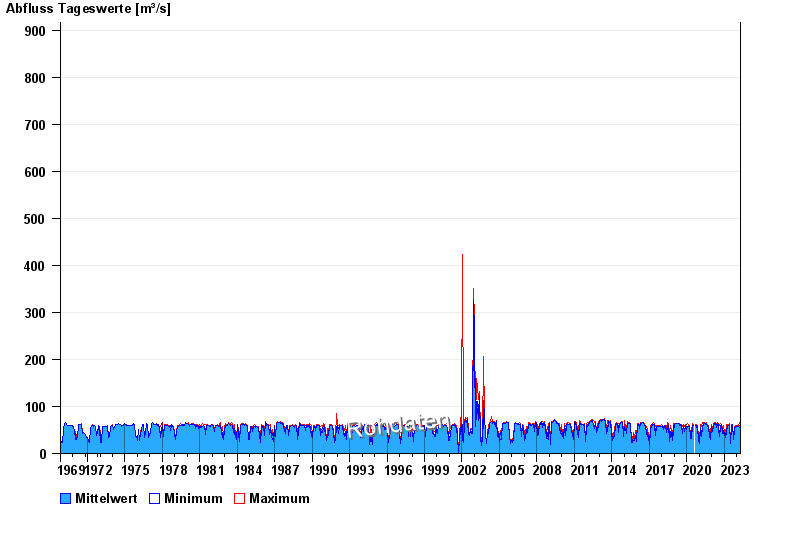 Für diesen Pegel sind keine Jährlichkeiten hinterlegt.
| Date | Mean value [m³/s] | Maximum [m³/s] | Minimum [m³/s] |
|---|---|---|---|
| 25.04.2024 | 55.5 | 56.6 | 53 |
| 24.04.2024 | 55.9 | 57.2 | 54.8 |
| 23.04.2024 | 55.3 | 56.6 | 54.2 |
| 22.04.2024 | 58.5 | 61.4 | 56.6 |
| 21.04.2024 | 58.4 | 60.8 | 56.6 |
| 20.04.2024 | 56.8 | 60.8 | 52.4 |
| 19.04.2024 | 50.8 | 53.6 | 49.5 |
© Bayerisches Landesamt für Umwelt 2024