

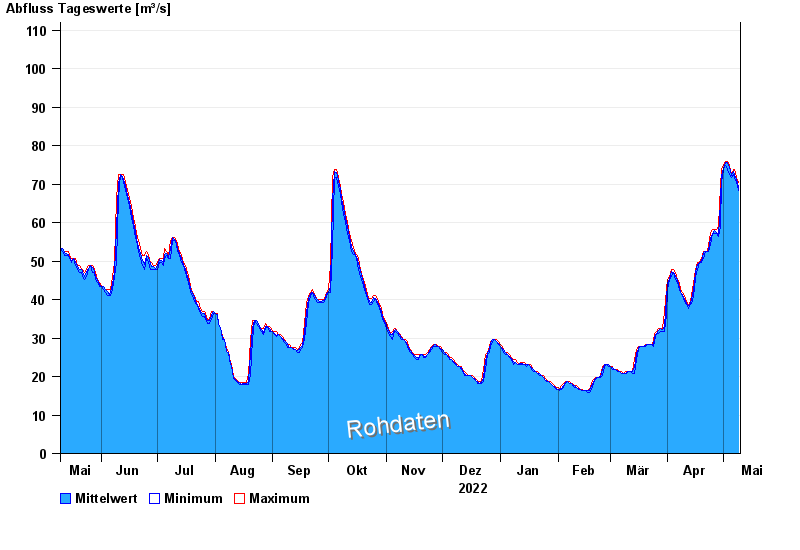
Chart of year Seebruck / Alz
Discharge from 10.05.2022 to 09.05.2023
- 12.06.1965 Abfluss: 312 m³/s
- 03.06.2013 Abfluss: 308 m³/s
- 11.07.1954 Abfluss: 268 m³/s
- 02.06.1940 Abfluss: 225 m³/s
- 20.05.1965 Abfluss: 221 m³/s
| Date | Mean value [m³/s] | Maximum [m³/s] | Minimum [m³/s] |
|---|---|---|---|
| 09.05.2023 | 69.1 | 70.5 | 68.4 |
| 08.05.2023 | 71.1 | 71.6 | 70.5 |
| 07.05.2023 | 72.6 | 73.7 | 71.6 |
| 06.05.2023 | 73.3 | 73.7 | 72.6 |
| 05.05.2023 | 72.2 | 72.6 | 71.6 |
| 04.05.2023 | 74.2 | 74.8 | 72.6 |
| 03.05.2023 | 75.7 | 75.9 | 73.7 |
© Bayerisches Landesamt für Umwelt 2024