

Chart of year Seebruck / Alz
Discharge from 10.05.2020 to 09.05.2021
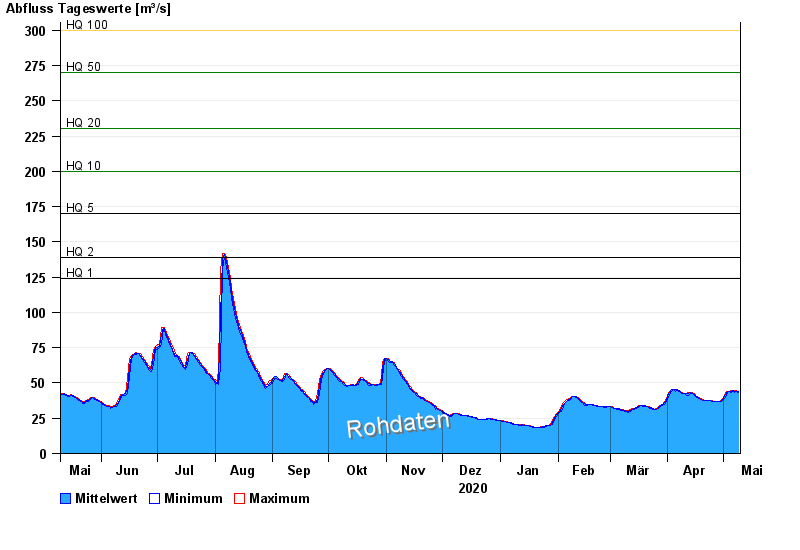
- HQ1 124 m³/s
- HQ2 139 m³/s
- HQ5 170 m³/s
- HQ10 200 m³/s
- HQ20 230 m³/s
- HQ50 270 m³/s
- HQ100 300 m³/s
| Date | Mean value [m³/s] | Maximum [m³/s] | Minimum [m³/s] |
|---|---|---|---|
| 09.05.2021 | 43.6 | 43.9 | 43 |
| 08.05.2021 | 44.2 | 44.7 | 43.9 |
| 07.05.2021 | 44.2 | 44.7 | 43 |
| 06.05.2021 | 44.4 | 44.7 | 43.9 |
| 05.05.2021 | 44 | 44.7 | 43 |
| 04.05.2021 | 43.9 | 43.9 | 43.9 |
| 03.05.2021 | 43.6 | 43.9 | 43 |
© Bayerisches Landesamt für Umwelt 2024