

Chart of year Seebruck / Alz
Discharge from 15.06.2020 to 14.06.2021
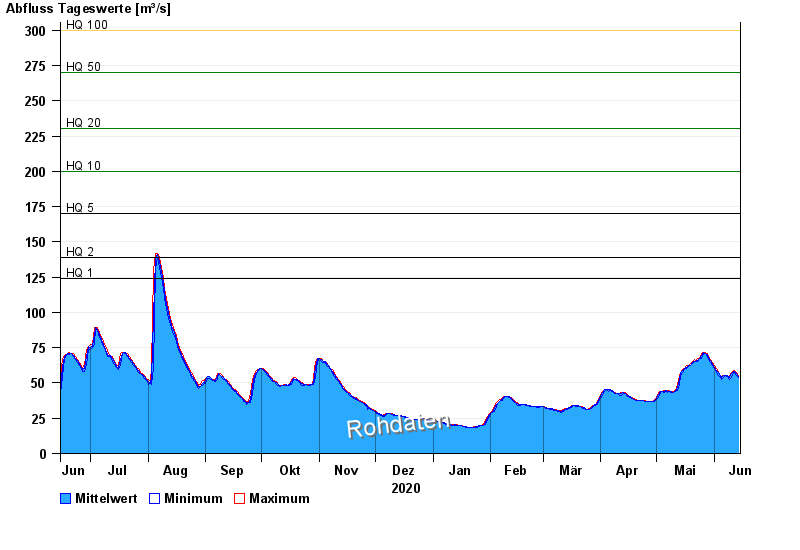
- HQ1 124 m³/s
- HQ2 139 m³/s
- HQ5 170 m³/s
- HQ10 200 m³/s
- HQ20 230 m³/s
- HQ50 270 m³/s
- HQ100 300 m³/s
| Date | Mean value [m³/s] | Maximum [m³/s] | Minimum [m³/s] |
|---|---|---|---|
| 14.06.2021 | 54.8 | 55.6 | 53.7 |
| 13.06.2021 | 56.5 | 57.6 | 55.6 |
| 12.06.2021 | 58.1 | 58.5 | 57.6 |
| 11.06.2021 | 58.3 | 58.5 | 57.6 |
| 10.06.2021 | 56.5 | 57.6 | 53.7 |
| 09.06.2021 | 54.1 | 54.6 | 52.7 |
| 08.06.2021 | 55.2 | 55.6 | 54.6 |
© Bayerisches Landesamt für Umwelt 2024