

Chart of year Seebruck / Alz
Discharge from 01.01.2021 to 31.12.2021
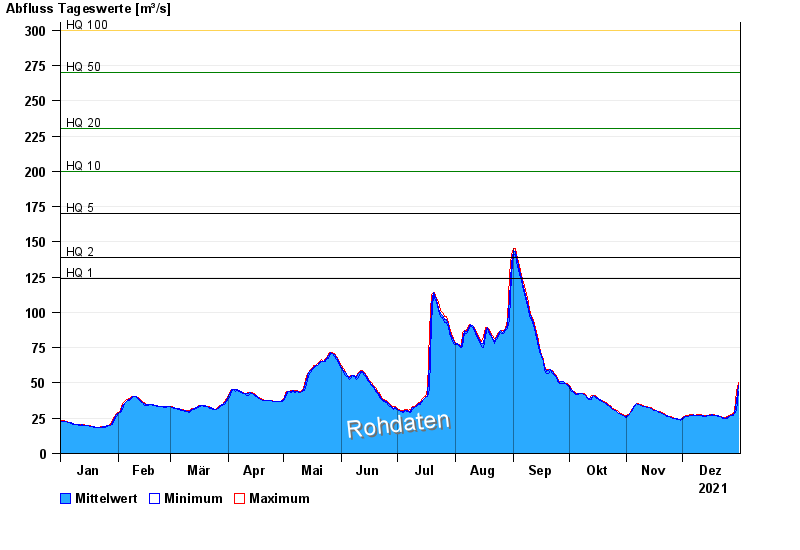
- HQ1 124 m³/s
- HQ2 139 m³/s
- HQ5 170 m³/s
- HQ10 200 m³/s
- HQ20 230 m³/s
- HQ50 270 m³/s
- HQ100 300 m³/s
| Date | Mean value [m³/s] | Maximum [m³/s] | Minimum [m³/s] |
|---|---|---|---|
| 31.12.2021 | 48.1 | 50.4 | 44.2 |
| 30.12.2021 | 36.9 | 44.2 | 30.2 |
| 29.12.2021 | 28.5 | 30.2 | 28.1 |
| 28.12.2021 | 27.4 | 28.1 | 26.8 |
| 27.12.2021 | 26.8 | 27.4 | 26.8 |
| 26.12.2021 | 26.3 | 26.8 | 26.1 |
| 25.12.2021 | 25.5 | 26.1 | 24.8 |
© Bayerisches Landesamt für Umwelt 2024