

Chart of total period Seebruck / Alz
Discharge from 01.11.1930 to 19.04.2024
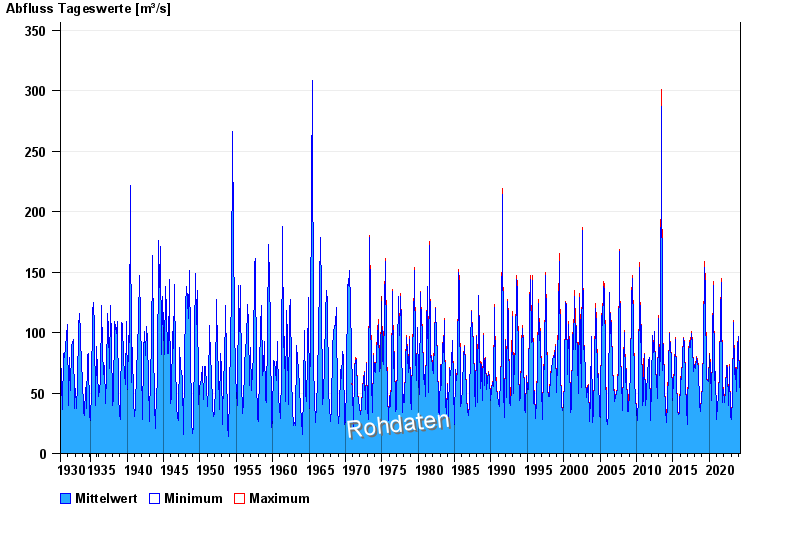
| Date | Mean value [m³/s] | Maximum [m³/s] | Minimum [m³/s] |
|---|---|---|---|
| 19.04.2024 | 45.8 | 45.9 | 45 |
| 18.04.2024 | 45.6 | 45.9 | 45 |
| 17.04.2024 | 47.3 | 49.5 | 44.2 |
| 16.04.2024 | 48.4 | 49.5 | 47.7 |
| 15.04.2024 | 48 | 48.6 | 47.7 |
| 14.04.2024 | 48 | 48.6 | 47.7 |
| 13.04.2024 | 48.6 | 48.6 | 48.6 |
© Bayerisches Landesamt für Umwelt 2024