
- Start >
- Rivers >
- Discharge >
- Isar >
- Rottersdorf >
- Chart of year

Chart of year Rottersdorf / Vils
Discharge from 02.12.2020 to 01.12.2021
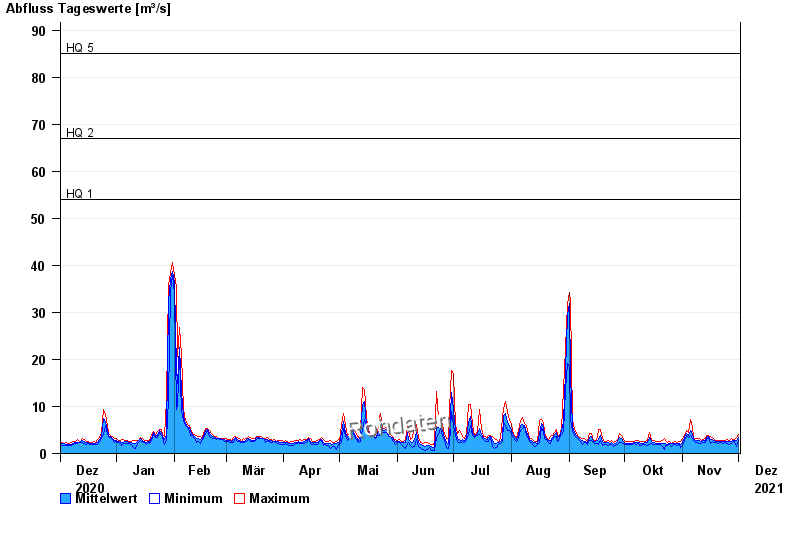
- HQ1 54 m³/s
- HQ2 67 m³/s
- HQ5 85 m³/s
- HQ10 98 m³/s
- HQ20 110 m³/s
| Date | Mean value [m³/s] | Maximum [m³/s] | Minimum [m³/s] |
|---|---|---|---|
| 01.12.2021 | 3.42 | 3.99 | 2.73 |
| 30.11.2021 | 2.87 | 3.47 | 1.54 |
| 29.11.2021 | 2.8 | 3.01 | 2.47 |
| 28.11.2021 | 2.7 | 3.01 | 2.47 |
| 27.11.2021 | 2.56 | 3.16 | 2.22 |
| 26.11.2021 | 2.59 | 2.87 | 1.86 |
| 25.11.2021 | 2.55 | 3.01 | 2.09 |
© Bayerisches Landesamt für Umwelt 2024